
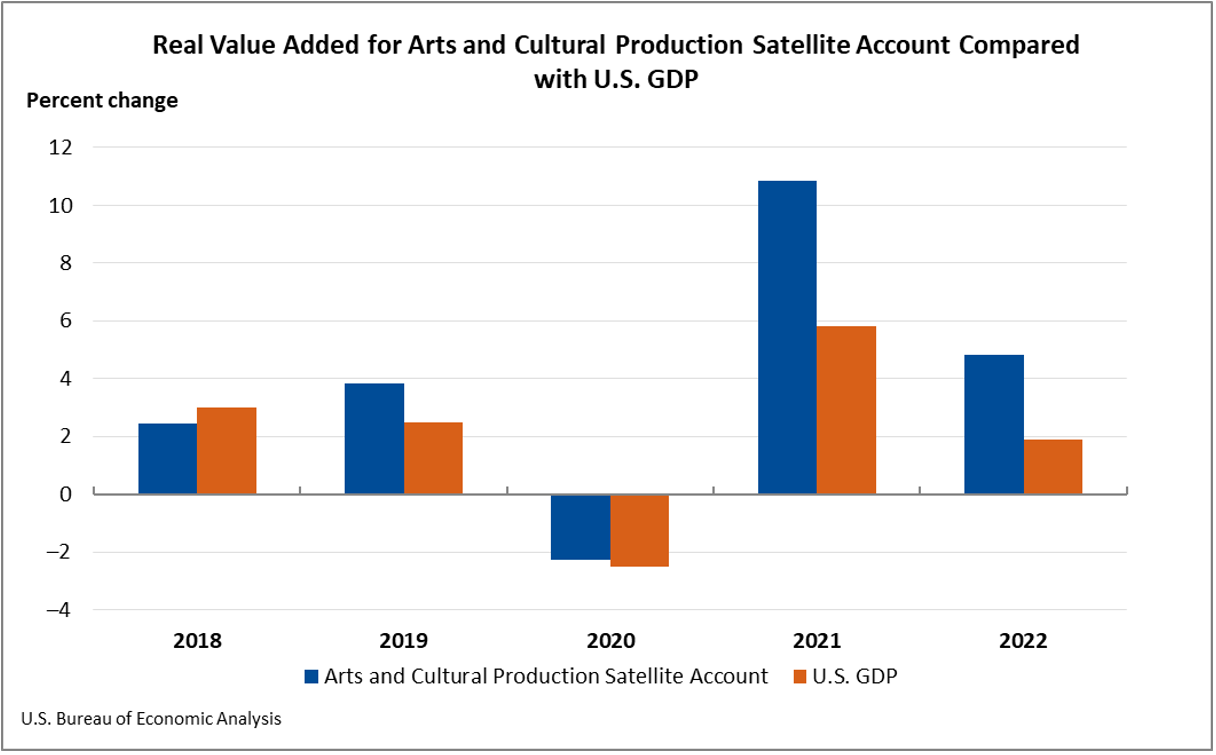
Arts and cultural economic activity, adjusted for inflation, increased 4.8 percent in 2022 after increasing 10.8 percent in 2021, according to statistics released today by the Bureau of Economic Analysis. By comparison, the broader economy, as measured by real gross domestic product, increased 1.9 percent in 2022 after increasing 5.8 percent in 2021.
Arts and cultural economic activity accounted for 4.3 percent of GDP, or $1.10 trillion, in 2022, the Arts and Cultural Production Satellite Account shows.
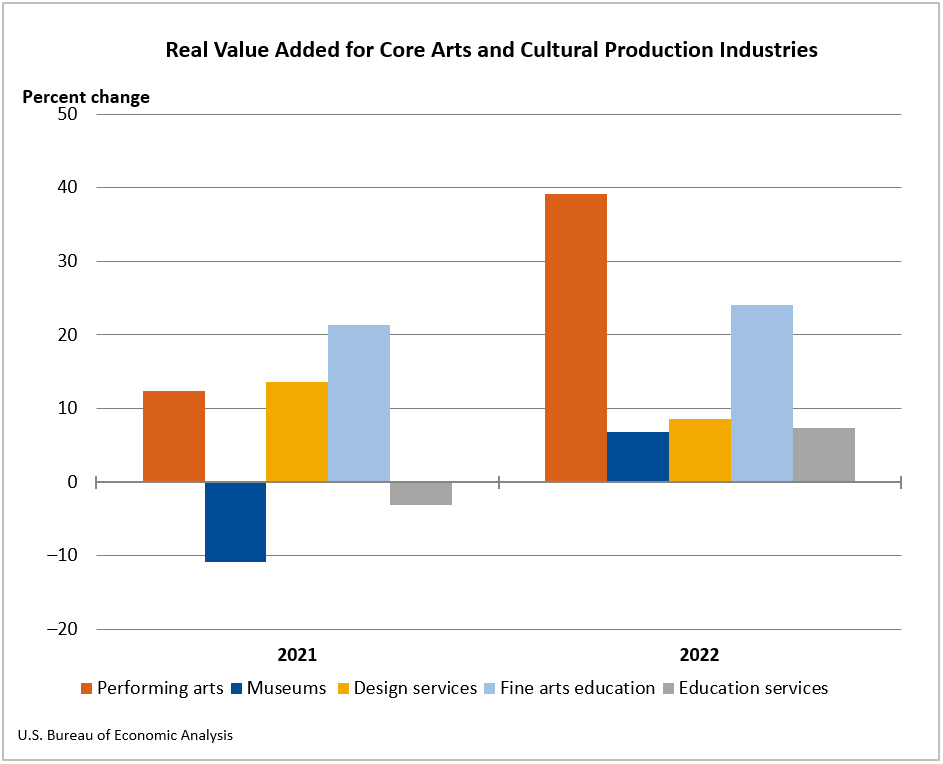
Real (inflation-adjusted) value added for core arts and cultural production industries, which include performing arts, museums, design services, fine arts education, and education services, increased 18.2 percent in 2022. Supporting arts and cultural production industries, which include art support services and information services, increased 1.4 percent in 2022.
- Performing arts increased 39.2 percent in 2022 after increasing 12.4 percent in 2021. The leading contributor to the increase was performing arts companies, which increased 76.5 percent in 2022 after decreasing 27.8 percent in 2021.
- Museums increased 6.9 percent in 2022 after decreasing 10.9 percent in 2021.
- Design services increased 8.5 percent in 2022 after increasing 13.6 percent in 2021.
- Fine arts education increased 24.0 percent in 2022 after increasing 21.4 percent in 2021.
- Education services increased 7.3 percent in 2022 after decreasing 3.1 percent in 2021.
Nominal value added
Nominal value added (not adjusted for inflation) increased 7.8 percent nationally in 2022. The leading contributor to the increase was core arts and cultural production industries, which increased 21.8 percent in 2022 to a level of $249.0 billion; the leading contributors to the increase were performing arts and design services.
Supporting arts and cultural production industries increased 4.1 percent to a level of $825.6 billion; the leading contributor to the increase was information services.
In 2022, nominal value added in arts and cultural production industries increased in every state and the District of Columbia. The percent change across all states ranged from 23.9 percent in Connecticut to 2.0 percent in Nebraska.
In Connecticut—the state with the largest increase in value added—broadcasting, other information services, and design services were the leading contributors to the increase in value added. In Nebraska—the state with the smallest increase in value added—a decrease in other information services mitigated the increase.
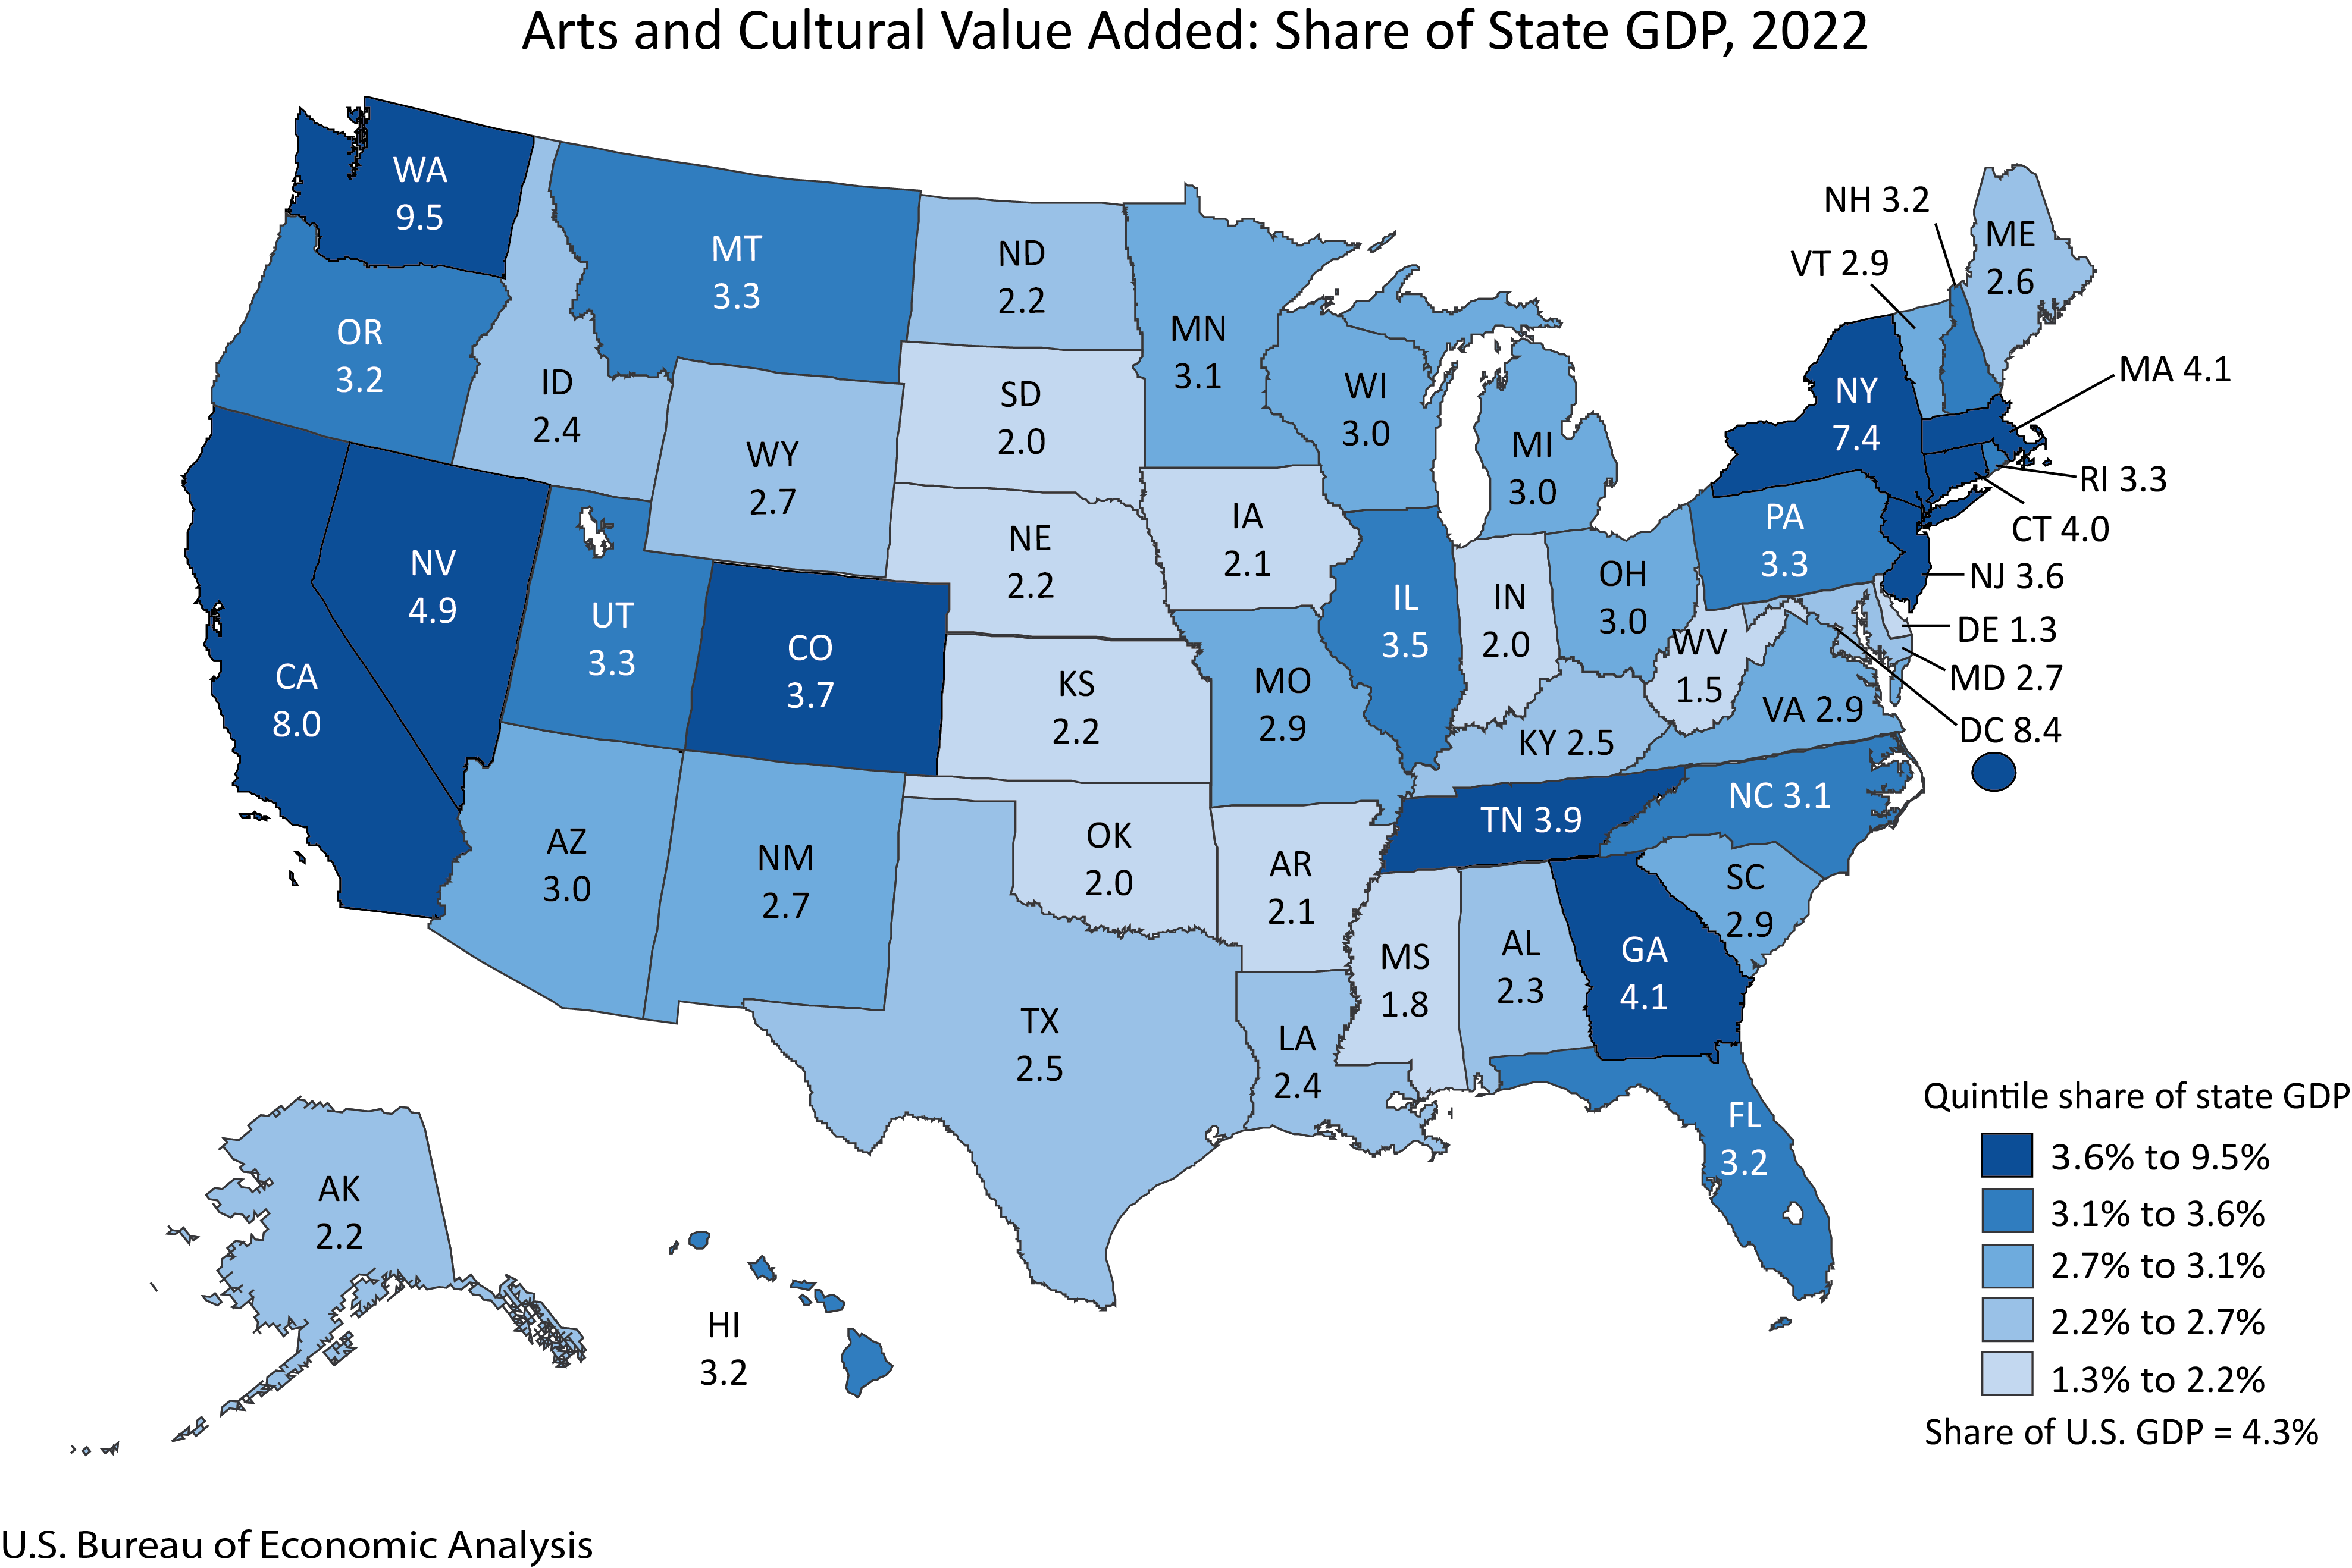
For all states and the District of Columbia, the arts and cultural share of total GDP ranged from 9.5 percent in Washington to 1.3 percent in Delaware. The share for most states ranged between 2 and 5 percent. Washington, the District of Columbia, California, and New York were the only areas where the arts and cultural share of total GDP exceeded 5 percent.
In addition to new statistics for 2022, today BEA also released updated national and state statistics for 2017 to 2021, reflecting the incorporation of revised and newly available source data from the 2023 comprehensive updates of BEA’s National and Regional Economic Accounts.
BEA’s Arts and Cultural Production Satellite Account is sponsored by funding from the National Endowment for the Arts. It is one of several satellite accounts that complement BEA’s core statistics, such as GDP, by pulling together additional detail on specific industries.
Visit BEA’s arts and cultural production webpage for the full report and an interactive map of the arts and culture economy in each state.