
News Release
Gross Domestic Product, Fourth Quarter and Annual 2018 (Initial Estimate)
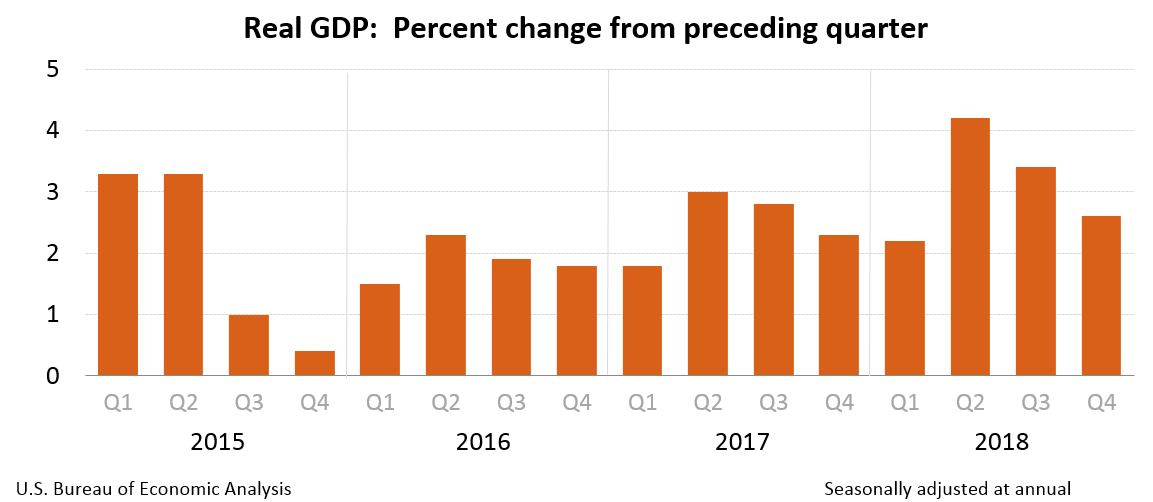
Real gross domestic product (GDP) increased at an annual rate of 2.6 percent in the fourth quarter of 2018 (table 1), according to the "initial" estimate released by the Bureau of Economic Analysis. In the third quarter, real GDP increased 3.4 percent.
Due to the recent partial government shutdown, this initial report for the fourth quarter and annual GDP for 2018 replaces the release of the "advance" estimate originally scheduled for January 30th and the "second" estimate originally scheduled for February 28th. See the Technical Note for details.
The Bureau emphasized that the fourth-quarter initial estimate released today is based on source data that are incomplete or subject to further revision by the source agency (see “Source Data for the Initial Estimate” on page 3). Updated estimates for the fourth quarter, based on more complete data, will be released on March 28, 2019.
The increase in real GDP in the fourth quarter reflected positive contributions from personal consumption expenditures (PCE), nonresidential fixed investment, exports, private inventory investment, and federal government spending. Those were partly offset by negative contributions from residential fixed investment, and state and local government spending. Imports, which are a subtraction in the calculation of GDP, increased (table 2).
The deceleration in real GDP growth in the fourth quarter reflected decelerations in private inventory investment, PCE, and federal government spending and a downturn in state and local government spending. These movements were partly offset by an upturn in exports and an acceleration in nonresidential fixed investment. Imports increased less in the fourth quarter than in the third quarter.
Current dollar GDP increased 4.6 percent, or $233.2 billion, in the fourth quarter to a level of $20.89 trillion. In the third quarter, current-dollar GDP increased 4.9 percent, or $246.3 billion (table 1 and table 3).
The price index for gross domestic purchases increased 1.6 percent in the fourth quarter, compared with an increase of 1.8 percent in the third quarter (table 4). The PCE price index increased 1.5 percent, compared with an increase of 1.6 percent. Excluding food and energy prices, the PCE price index increased 1.7 percent, compared with an increase of 1.6 percent.
Personal Income (table 8)
Current-dollar personal income increased $225.1 billion in the fourth quarter, compared with an increase of $190.6 billion in the third quarter. The acceleration in personal income reflected an upturn in farm proprietors’ income and accelerations in personal dividend income and personal interest income. Compensation of employees decelerated.
Disposable personal income increased $218.7 billion, or 5.7 percent, in the fourth quarter, compared with an increase of $160.9 billion, or 4.2 percent, in the third quarter. Real disposable personal income increased 4.2 percent, compared with an increase of 2.6 percent.
Personal saving was $1.06 trillion in the fourth quarter, compared with $996.0 billion in the third quarter. The personal saving rate -- personal saving as a percentage of disposable personal income -- was 6.7 percent in the fourth quarter, compared with 6.4 percent in the third quarter.
Updates to third quarter GDI
For the third quarter of 2018, the percent change in real GDI was revised from 4.3 percent to 4.6 percent based on newly available tabulations from the BLS Quarterly Census of Employment and Wages program.
2018 GDP
Real GDP increased 2.9 percent in 2018 (from the 2017 annual level to the 2018 annual level), compared with an increase of 2.2 percent in 2017 (table 1).
The increase in real GDP in 2018 primarily reflected positive contributions from PCE, nonresidential fixed investment, exports, federal government spending, private inventory investment, and state and local government spending that were slightly offset by a small negative contribution from residential fixed investment. Imports, which are a subtraction in the calculation of GDP, increased (table 2).
The acceleration in real GDP from 2017 to 2018 primarily reflected accelerations in nonresidential fixed investment, private inventory investment, federal government spending, exports, and PCE, and an upturn in state and local government spending that were partly offset by a downturn in residential investment.
Current-dollar GDP increased 5.2 percent, or $1.02 trillion, in 2018 to a level of $20.50 trillion, compared with an increase of 4.2 percent, or $778.2 billion, in 2017 (table 1 and table 3).
The price index for gross domestic purchases increased 2.2 percent in 2018, compared with an increase of 1.9 percent in 2017 (table 4). The PCE price index increased 2.0 percent, compared with an increase of 1.8 percent. Excluding food and energy prices, the PCE price index increased 1.9 percent, compared with an increase of 1.6 percent (table 4).
During 2018 (measured from the fourth quarter of 2017 to the fourth quarter of 2018), real GDP increased 3.1 percent, compared with an increase of 2.5 percent during 2017. The price index for gross domestic purchases increased 2.1 percent during 2018, compared with an increase of 1.9 percent during 2017.
Source Data for the Initial Estimate
Information on the source data and key assumptions used for unavailable source data in the initial estimate is provided in a Technical Note that is posted with the news release on BEA’s Web site. A detailed "Key Source Data and Assumptions" file is also posted for each release. For information on updates to GDP, see the "Additional Information" section that follows.
* * *
Next release, March 28, 2019 at 8:30 A.M. EST
Gross Domestic Product, Fourth Quarter 2018
Corporate Profits, Fourth Quarter 2018
* * *