
News Release
Gross Domestic Product (Third Estimate), Corporate Profits (Revised Estimate), and GDP by Industry, Third Quarter 2023
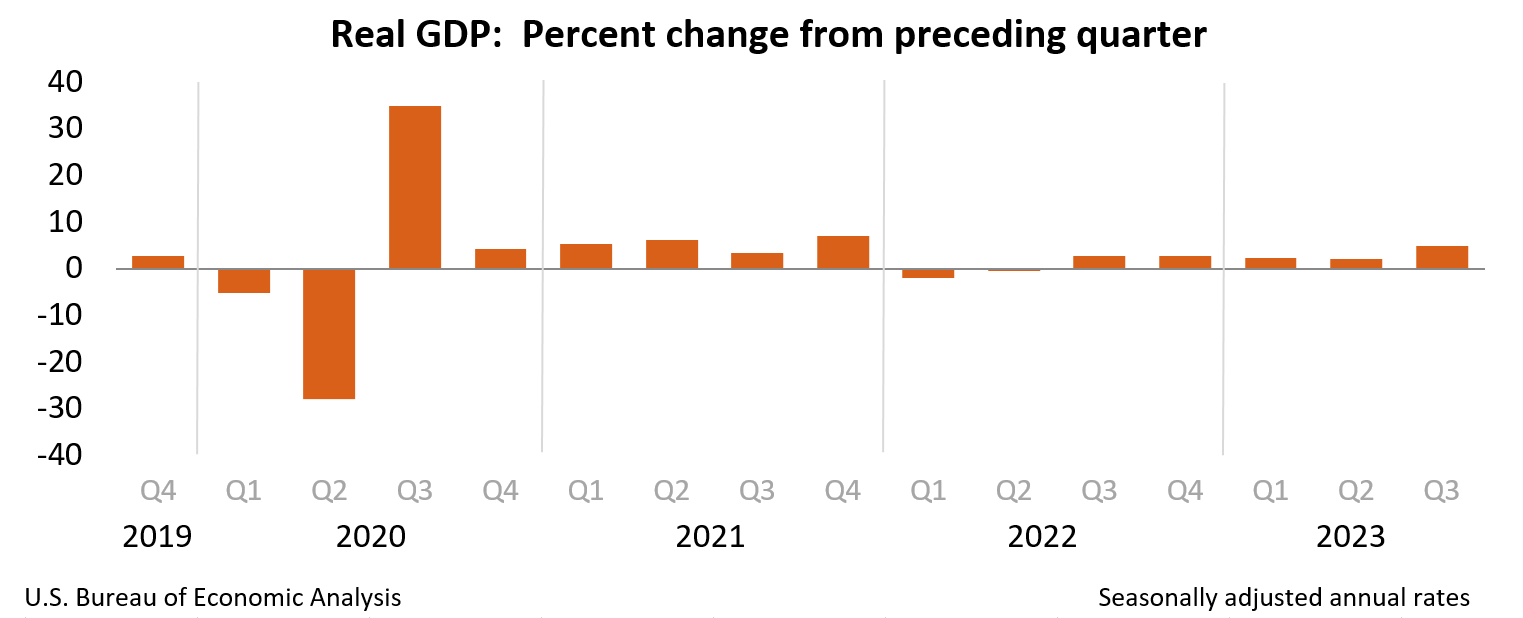
Real gross domestic product (GDP) increased at an annual rate of 4.9 percent in the third quarter of 2023 (table 1), according to the "third" estimate released by the Bureau of Economic Analysis. In the second quarter, real GDP increased 2.1 percent.
The GDP estimate released today is based on more complete source data than were available for the "second" estimate issued last month. In the second estimate, the increase in real GDP was 5.2 percent. The update primarily reflected a downward revision to consumer spending. Imports, which are a subtraction in the calculation of GDP, were revised down (refer to "Updates to GDP").
The increase in real GDP reflected increases in consumer spending, private inventory investment, exports, state and local government spending, federal government spending, residential fixed investment, and nonresidential fixed investment. Imports increased (table 2).
Compared to the second quarter, the acceleration in real GDP in the third quarter primarily reflected an upturn in exports and accelerations in consumer spending and private inventory investment that were partly offset by a deceleration in nonresidential fixed investment. Imports turned up.
Current‑dollar GDP increased 8.3 percent at an annual rate, or $547.1 billion, in the third quarter to a level of $27.61 trillion, a downward revision of $34.3 billion from the previous estimate (tables 1 and 3). More information on the source data that underlie the estimates is available in the "Key Source Data and Assumptions" file on BEA’s website
The price index for gross domestic purchases increased 2.9 percent in the third quarter, a downward revision of 0.1 percentage point from the previous estimate (table 4). The personal consumption expenditures (PCE) price index increased 2.6 percent, a downward revision of 0.2 percentage point. Excluding food and energy prices, the PCE price index increased 2.0 percent, a downward revision of 0.3 percentage point.
Personal Income
Current-dollar personal income increased $196.2 billion in the third quarter, a downward revision of $22.1 billion from the previous estimate. The increase in the third quarter primarily reflected increases in compensation (led by private wages and salaries), nonfarm proprietors’ income, and personal interest income that were partly offset by a decrease in personal current transfer receipts (table 8).
Disposable personal income increased $143.5 billion, or 2.9 percent, in the third quarter, a downward revision of $0.5 billion from the previous estimate. Real disposable personal income increased 0.3 percent, an upward revision of 0.2 percentage point.
Personal saving was $851.2 billion in the third quarter, an upward revision of $35.9 billion from the previous estimate. The personal saving rate—personal saving as a percentage of disposable personal income—was 4.2 percent in the third quarter, an upward revision of 0.2 percentage point.
Gross Domestic Income and Corporate Profits
Real gross domestic income (GDI) increased 1.5 percent in the third quarter, the same as previously published. The average of real GDP and real GDI, a supplemental measure of U.S. economic activity that equally weights GDP and GDI, increased 3.2 percent in the third quarter, a downward revision of 0.1 percentage point from the previous estimate (table 1).
Profits from current production (corporate profits with inventory valuation and capital consumption adjustments) increased $108.7 billion in the third quarter, an upward revision of $3.0 billion from the previous estimate (table 10).
Profits of domestic financial corporations increased $9.0 billion in the third quarter, a downward revision of $9.8 billion from the previous estimate. Profits of domestic nonfinancial corporations increased $90.8 billion, an upward revision of $14.7 billion. Rest-of-the-world profits increased $8.8 billion, a downward revision of $1.9 billion. In the third quarter, receipts increased $22.0 billion, and payments increased $13.2 billion.
Updates to GDP
With the third estimate, downward revisions to consumer spending, private inventory investment, and exports were partly offset by upward revisions to state and local government spending, nonresidential fixed investment, residential fixed investment, and federal government spending. Imports were revised down. For more information, refer to the Technical Note. For information on updates to GDP, refer to the "Additional Information" section that follows.
| Advance Estimate | Second Estimate | Third Estimate | |
|---|---|---|---|
| (Percent change from preceding quarter) | |||
| Real GDP | 4.9 | 5.2 | 4.9 |
| Current-dollar GDP | 8.5 | 8.9 | 8.3 |
| Real GDI | … | 1.5 | 1.5 |
| Average of Real GDP and Real GDI | … | 3.3 | 3.2 |
| Gross domestic purchases price index | 3.0 | 3.0 | 2.9 |
| PCE price index | 2.9 | 2.8 | 2.6 |
| PCE price index excluding food and energy | 2.4 | 2.3 | 2.0 |
Real GDP by Industry
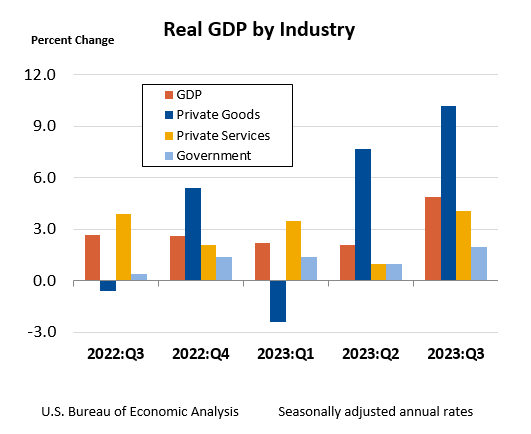
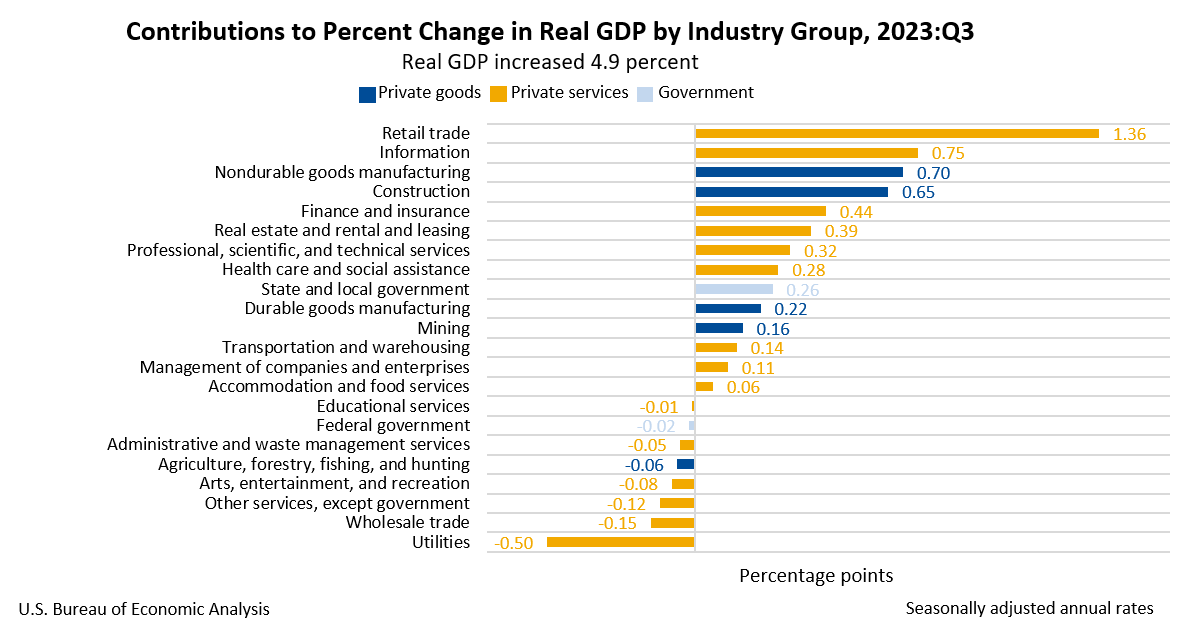
Today’s release includes estimates of GDP by industry, or value added—a measure of an industry’s contribution to GDP. Private goods-producing industries increased 10.2 percent, private services-producing industries increased 4.1 percent, and government increased 2.0 percent (table 12). Overall, 14 of 22 industry groups contributed to the third-quarter increase in real GDP.
- Within private goods-producing industries, the leading contributors to the increase were nondurable goods manufacturing (led by chemical products) and construction (table 13).
- Within private services-producing industries, the leading contributors to the increase were retail trade, information, as well as finance and insurance. Partly offsetting these increases was a decrease in utilities.
- The increase in government reflected an increase in state and local government that was partly offset by a decrease in federal government.
Gross Output by Industry
Real gross output—principally a measure of an industry’s sales or receipts, which includes sales to final users in the economy (GDP) and sales to other industries (intermediate inputs)—increased 3.5 percent in the third quarter. This reflected an increase of 4.0 percent for private goods-producing industries, an increase of 3.3 percent for private services-producing industries, and an increase of 3.3 percent for government (table 16). Overall, 16 of 22 industry groups contributed to the increase in real gross output.
* * *
Next release, January 25, 2024, at 8:30 a.m. EST
Gross Domestic Product, Fourth Quarter 2023 and Year 2023 (Advance Estimate)
* * *
| Release Dates in 2024 | ||||
|---|---|---|---|---|
| Estimate | 2023 Q4 and Year 2023 |
2024 Q1 | 2024 Q2 | 2024 Q3 |
| Gross Domestic Product | ||||
| Advance Estimate | January 25, 2024 | April 25, 2024 | July 25, 2024 | October 30, 2024 |
| Second Estimate | February 28, 2024 | May 30, 2024 | August 29, 2024 | November 27, 2024 |
| Third Estimate | March 28, 2024 | June 27, 2024 | September 26, 2024 | December 19, 2024 |
| Gross Domestic Product by Industry | March 28, 2024 | June 27, 2024 | September 26, 2024 | December 19, 2024 |
| Corporate Profits | ||||
| Preliminary Estimate | --- | May 30, 2024 | August 29, 2024 | November 27, 2024 |
| Revised Estimate | March 28, 2024 | June 27, 2024 | September 26, 2024 | December 19, 2024 |