
GDP by State
Real gross domestic product (GDP) increased in 46 states and the District of Columbia in the first quarter of 2026. State-level changes ranged from a 4.5 percent increase in Washington state to a 1.6 percent decrease in South Dakota.
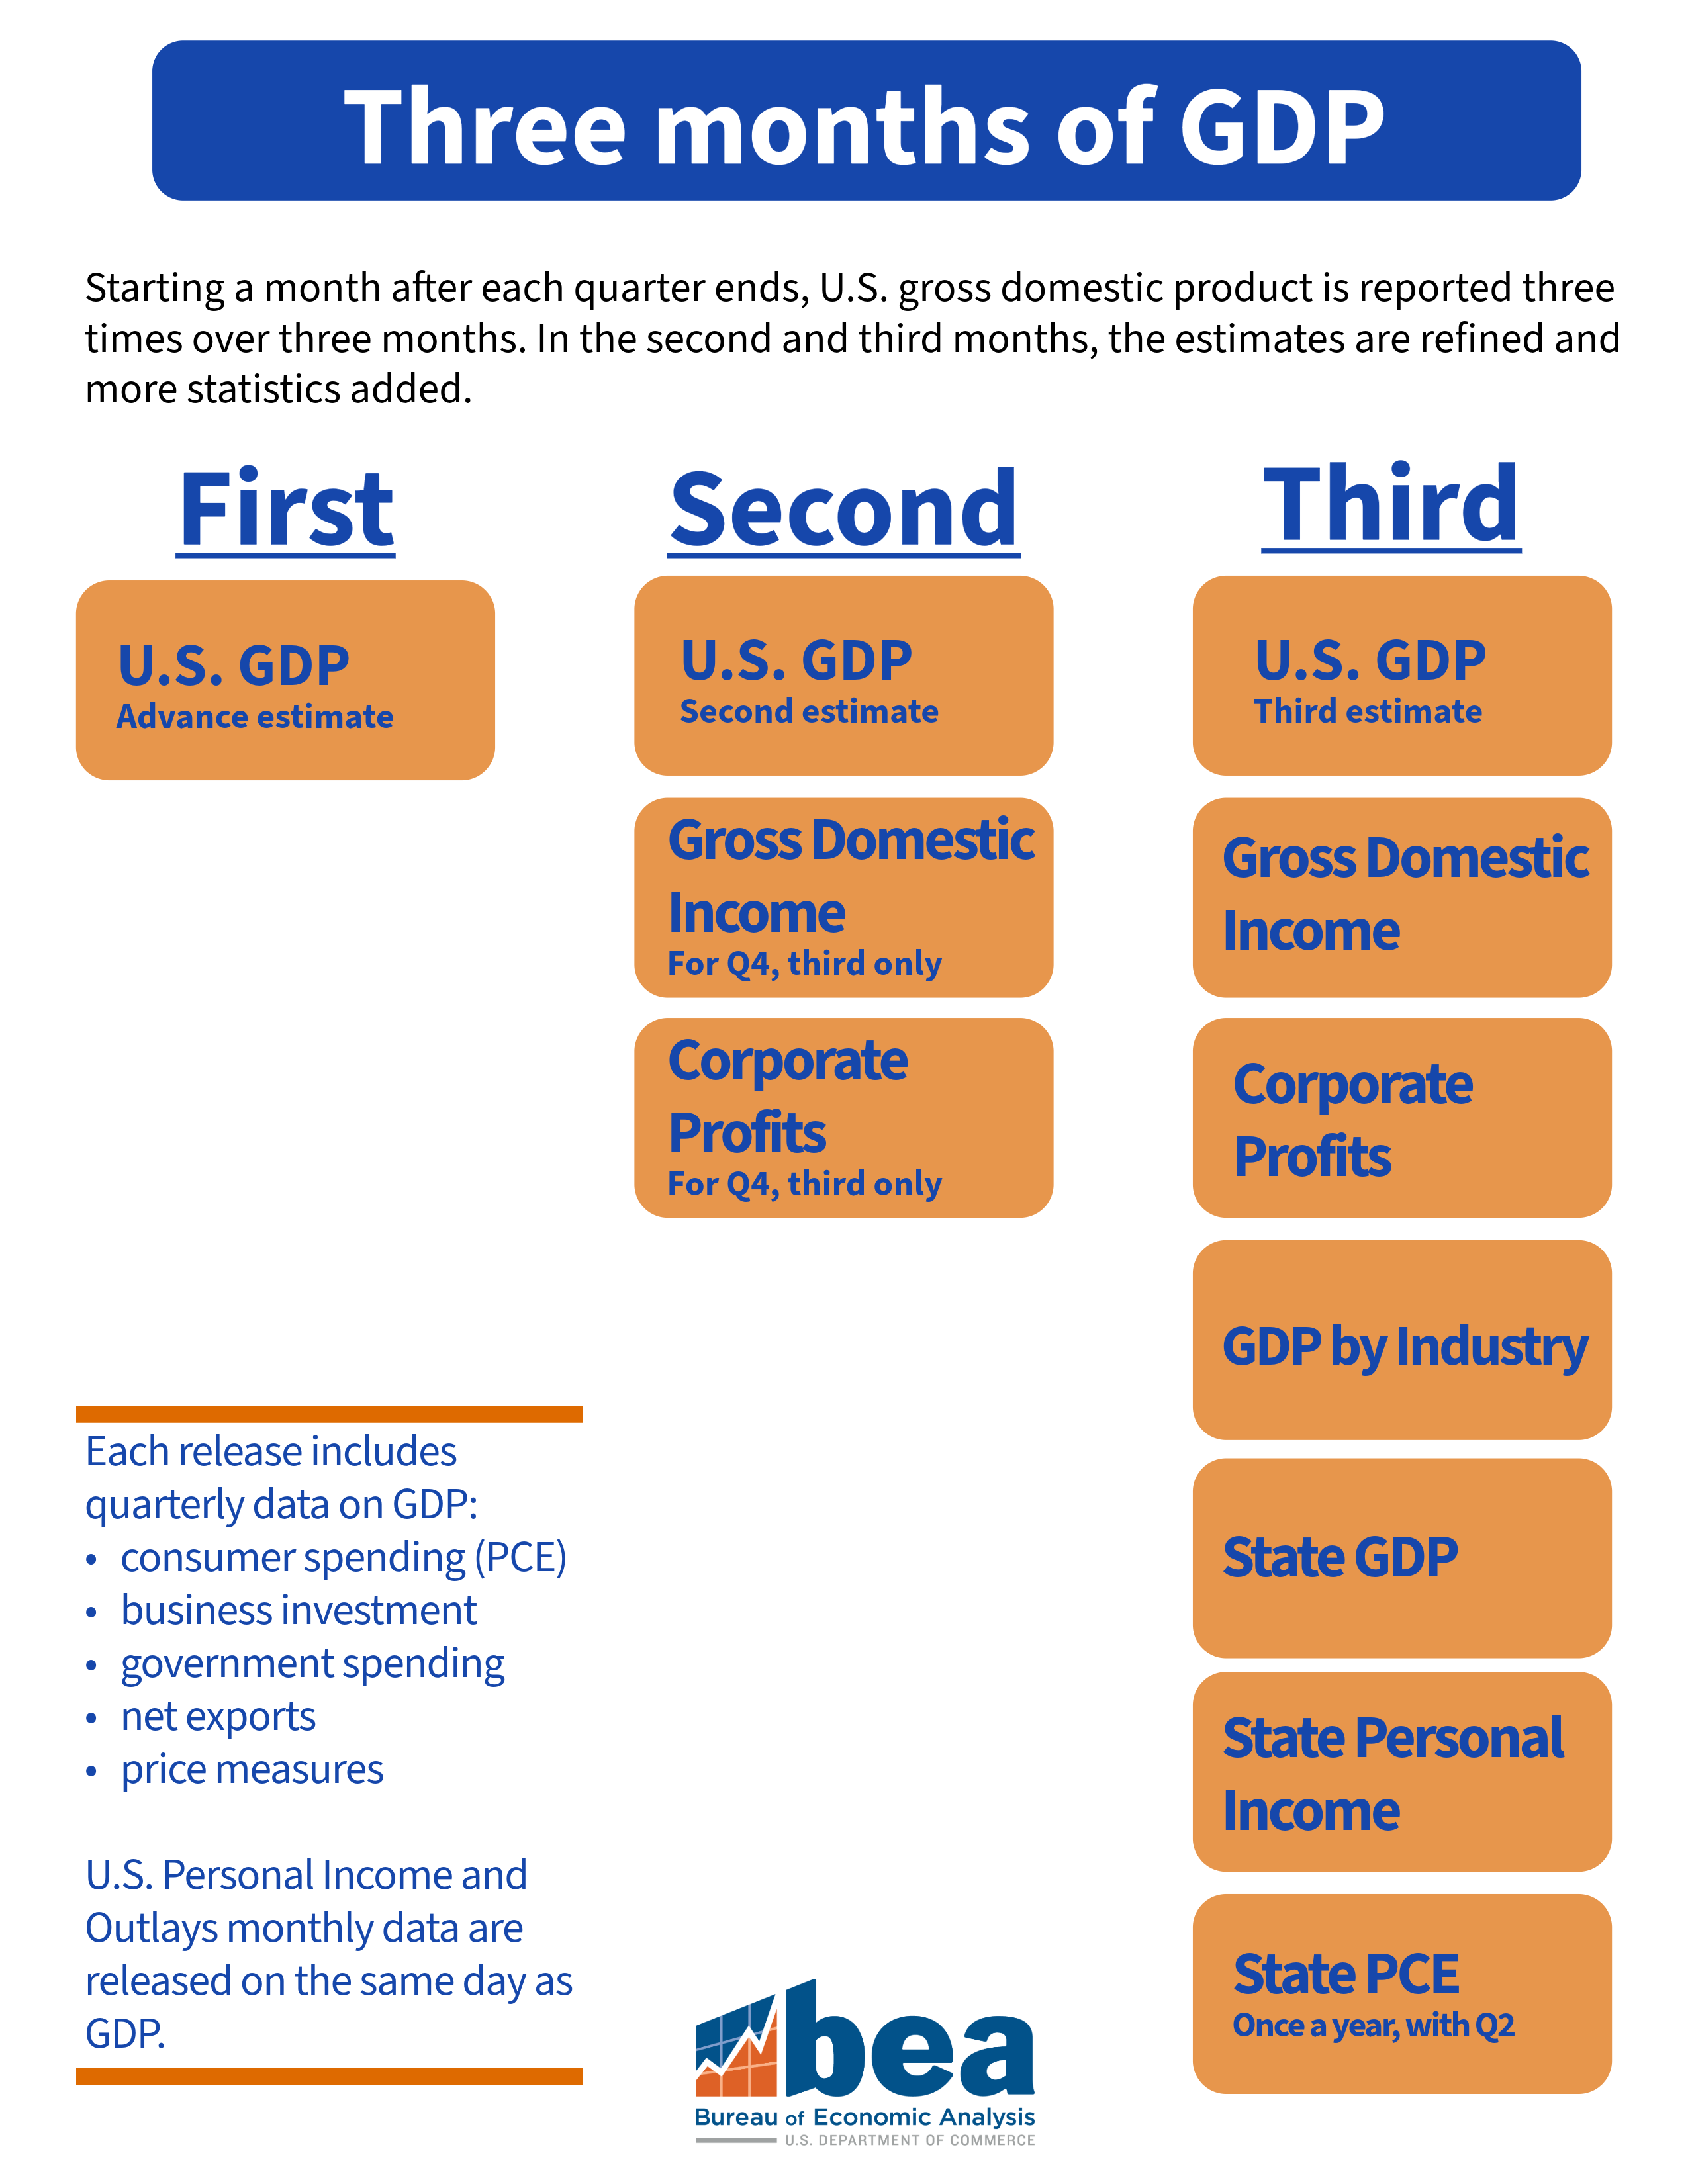
Note: GDP by state statistics are released with the third estimate of U.S. GDP each quarter and share the same news release.
Current Release: June 25, 2026 | Next Release: September 30, 2026

- Interactive Tables: GDP by state
- Interactive Maps: GDP by state
- BEARFACTS BEA Regional Fact Sheet about personal income and gross domestic product.
- Downloadable Data HTM
- Cautionary Note About Annual GDP by State Discontinuity
- Data Table Availability HTM
- Glossary HTM
- Component States in BEA Regions HTM
- GDP for the U.S. Territories
- Industry Names to NAICS Codes XLSX
- Three Months of GDP: Statistics Released With the Advance, Second, and Third Estimates PNG
- SCB, Results of the 2025 Annual Update of the Regional Economic Accounts, January 2026 HTM
- New and Updated Estimates of the Regional Economic Accounts: Results of the 2023 Comprehensive Update HTM | SCB, December 2023
- The 2022 Annual Update of the Regional Economic Accounts: New Statistics for 2021 and Updated Statistics for 2017–2020: Toward Regional Economic Recovery from the COVID–19 Pandemic HTM | SCB, November 2022
- Regional Quarterly Report, November 2020 HTM
- Regional Quarterly Report, May 2019 HTM
- Regional Quarterly Report, March 2019 HTM
- Data Archive HTML Previously published estimates contain historical data and have since been revised.
- News Release Archive
What is GDP by State?
A comprehensive measure of the economies of each state and the District of Columbia. GDP estimates the value of the goods and services produced in a state. The data include breakdowns of industries' contributions to each state economy.

Contact Personnel
-
GDP by StateTodd Siebeneck
-
MediaConnie O’Connell