
News Release
Gross Domestic Product by State and Personal Income by State, 2nd Quarter 2024
Real gross domestic product increased in 49 states and the District of Columbia in the second quarter of 2024, with the percent change ranging from 5.9 percent at an annual rate in Idaho to –1.1 percent in Alaska, according to statistics released today by the U.S. Bureau of Economic Analysis (table 1).
Current-dollar gross domestic product (GDP) increased in all 50 states and the District of Columbia, with the percent change ranging from 8.0 percent at an annual rate in Idaho to 3.0 percent in Alaska (table 1).
Personal income, in current dollars, increased in all 50 states and the District of Columbia, with the percent change ranging from 6.9 percent at an annual rate in South Carolina to 2.3 percent in North Dakota (table 3).
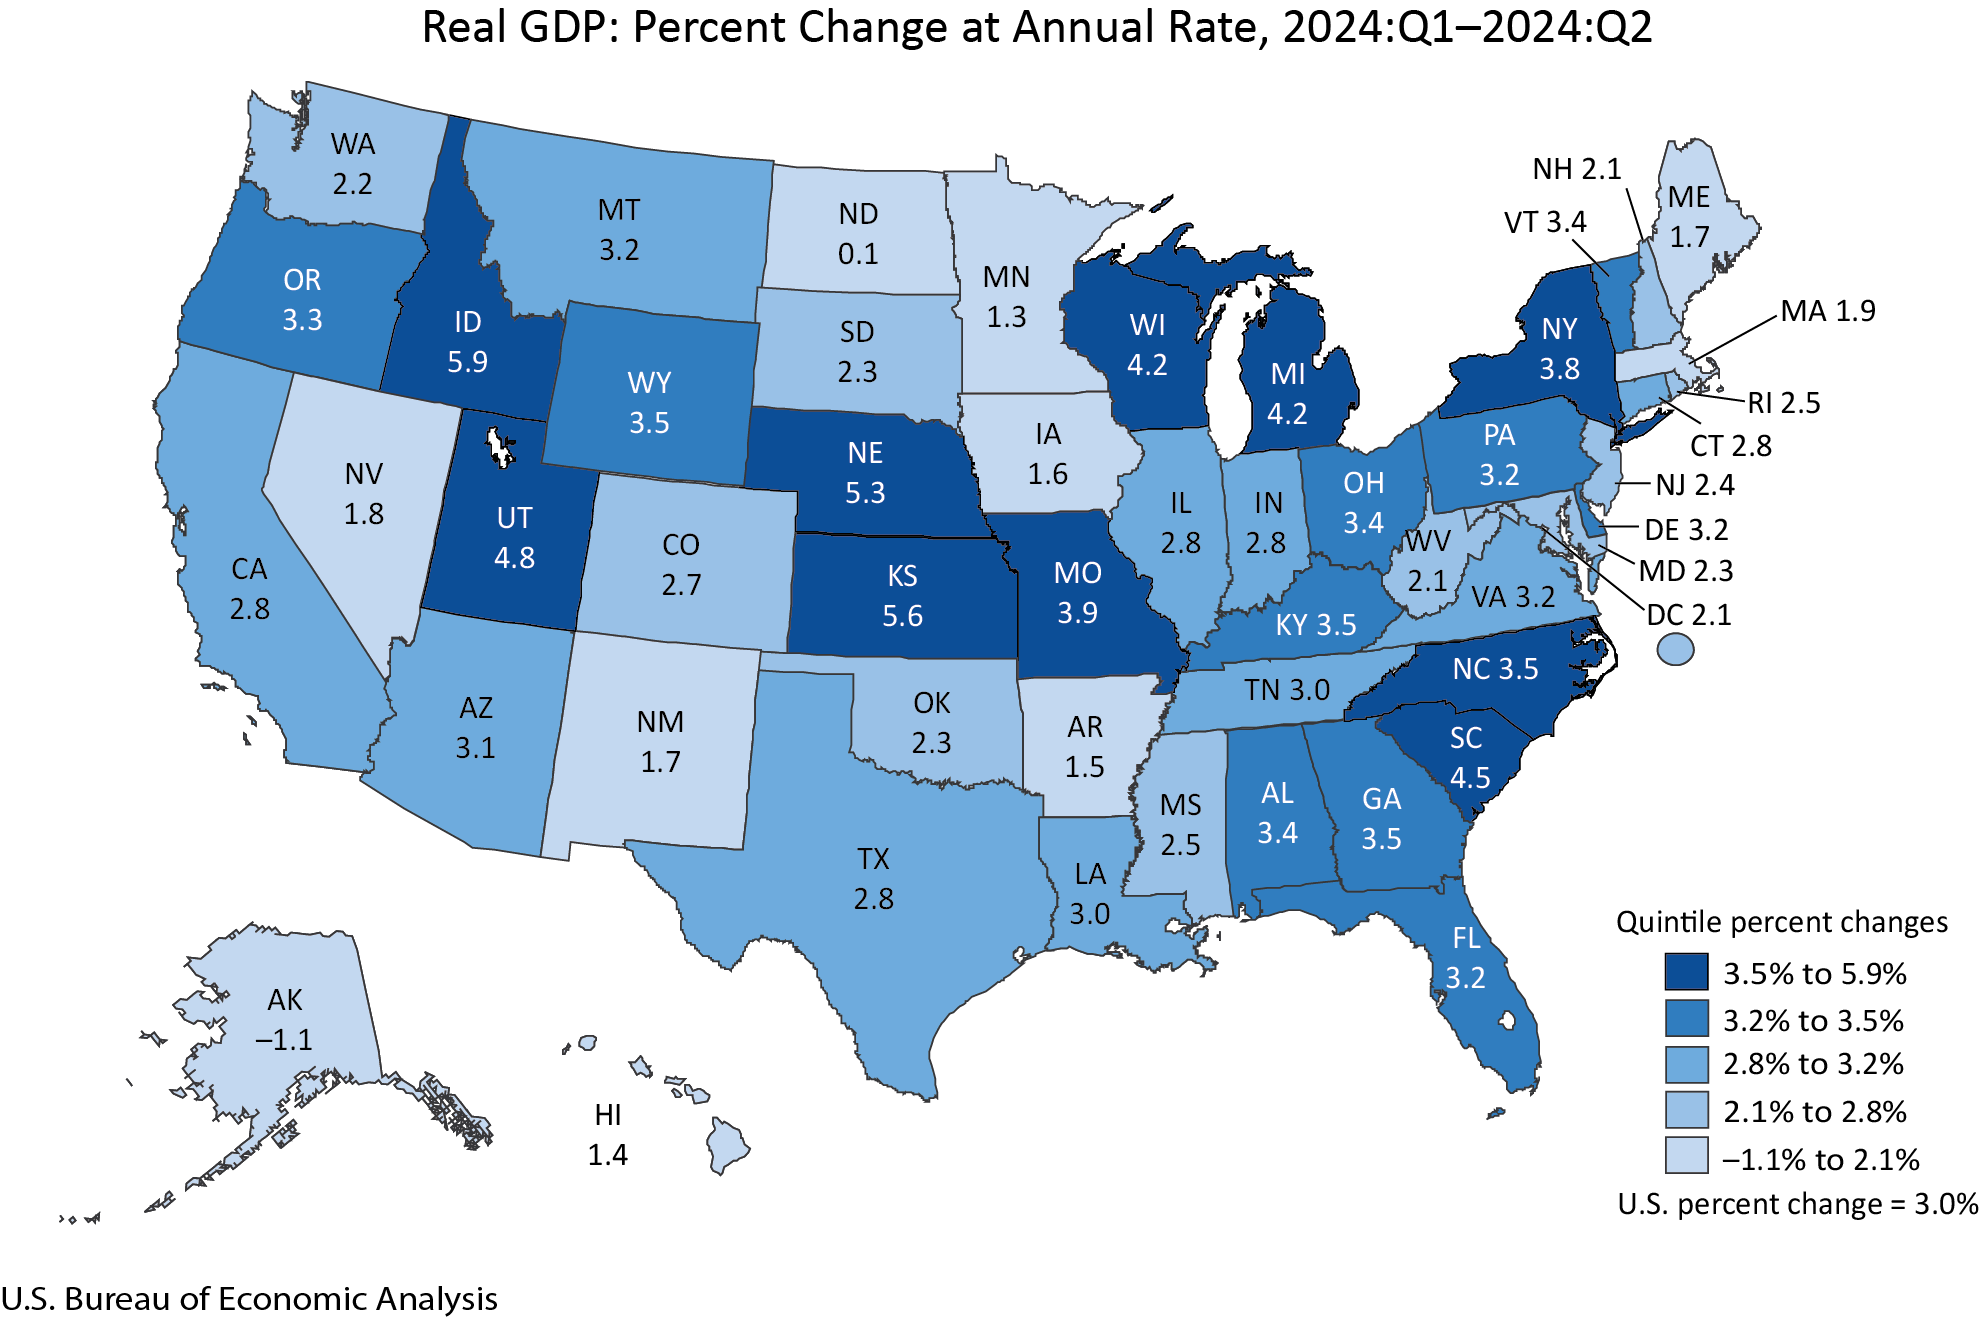
Real GDP
In the second quarter of 2024, real GDP for the nation grew at an annual rate of 3.0 percent. Real GDP increased in 16 of the 23 industry groups for which BEA prepares quarterly state estimates (table 2). Nondurable-goods manufacturing, finance and insurance, and health care and social assistance were the leading contributors to growth in real GDP nationally (table 2).
- Agriculture, forestry, fishing, and hunting, which increased in 29 states, was the leading contributor to growth in 11 states including Idaho, Kansas, and Nebraska, the states with the fastest increases in real GDP. In contrast, this industry was the leading offset to growth in 10 states including North Dakota, the slowest growing state.
- Nondurable-goods manufacturing, which increased in all 50 states and the District of Columbia, was the leading contributor to growth in 12 states including Utah, the state with the fourth-fastest increase in real GDP.
- Mining, which declined in 33 states, was the leading contributor to the decrease in real GDP in Alaska, the only state with a decline in real GDP.
Personal income
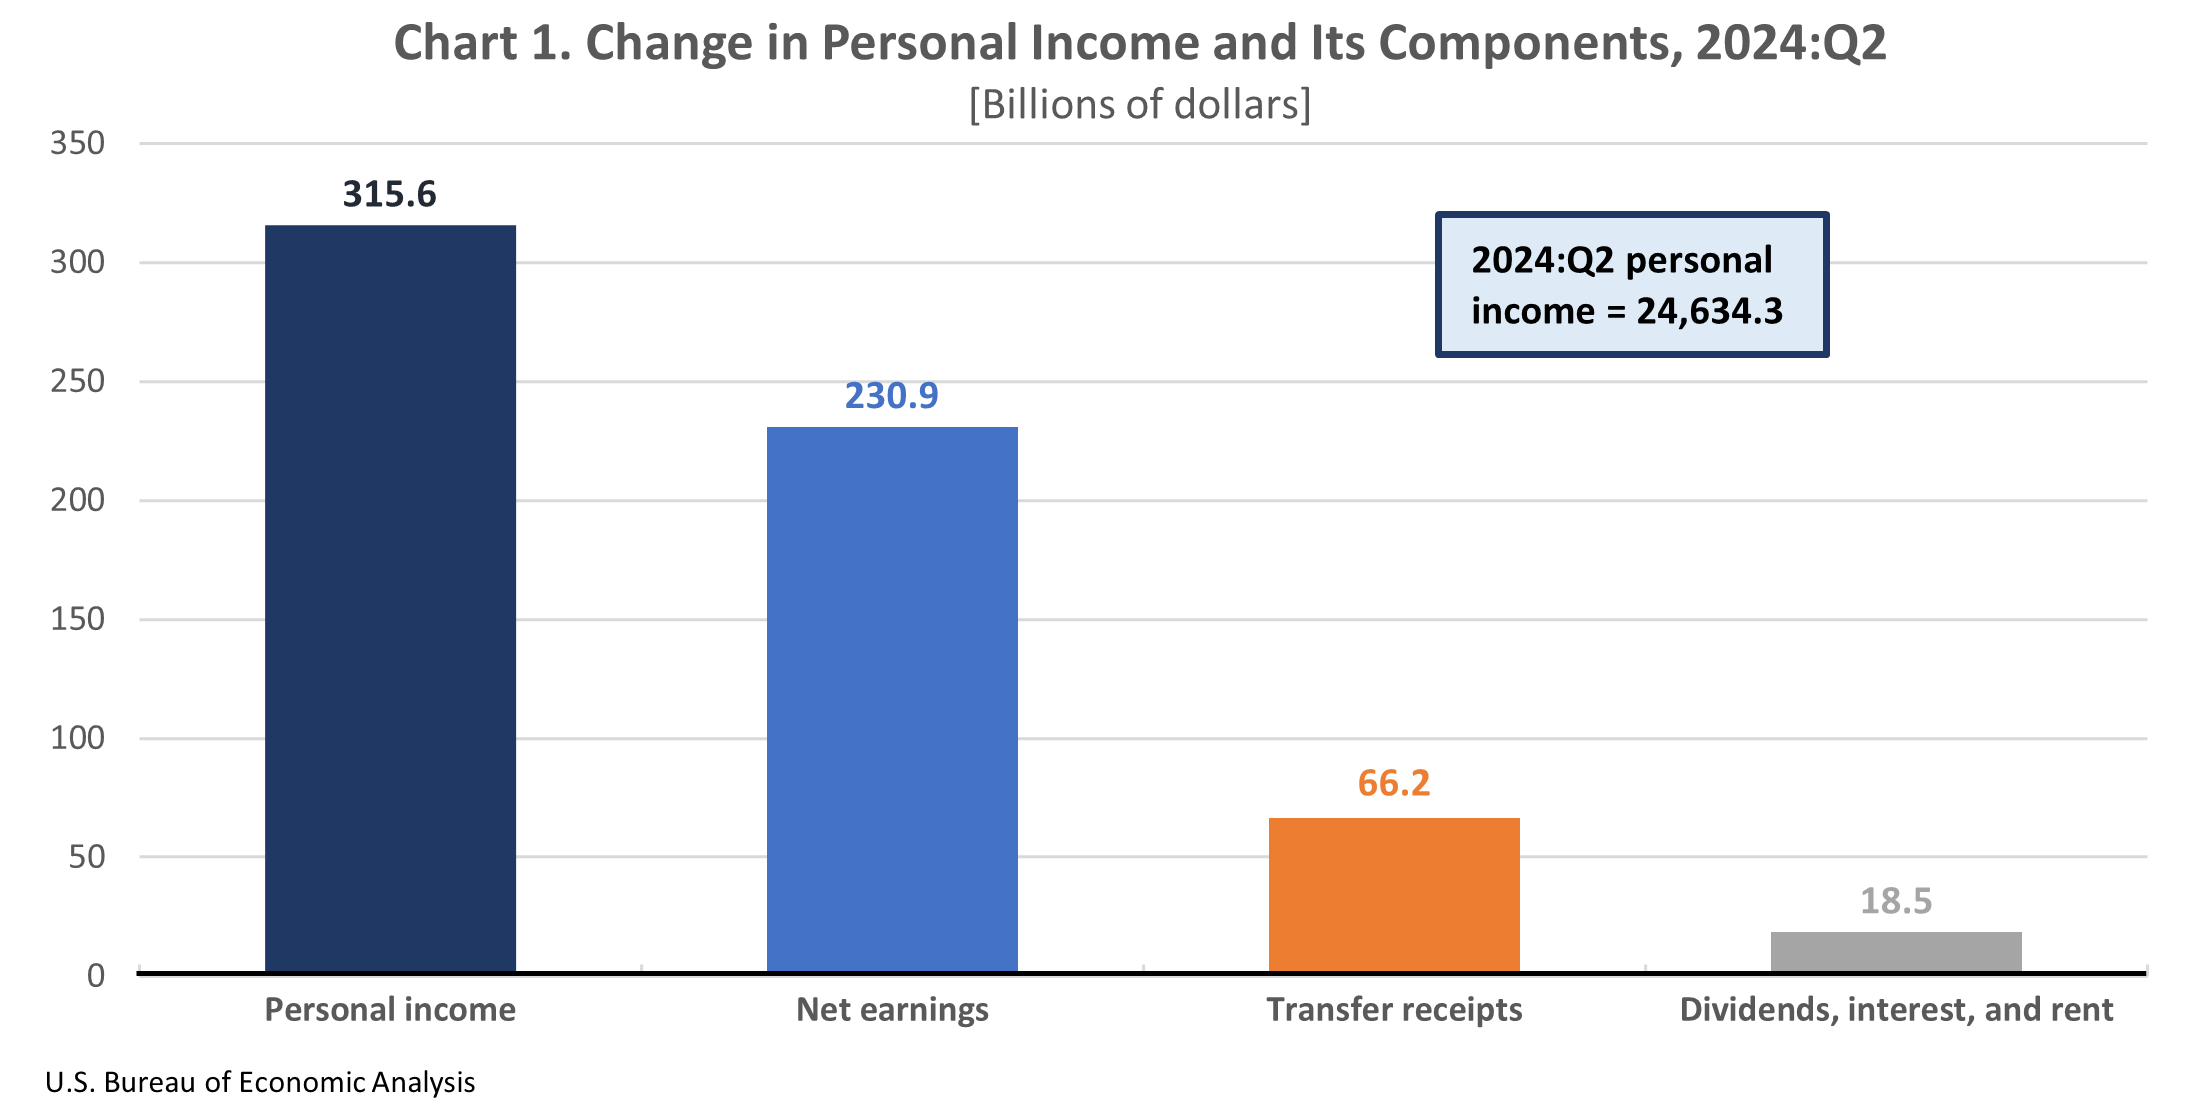
In the second quarter of 2024, current-dollar personal income increased $315.6 billion, or 5.3 percent at an annual rate (table 3). Nationally, earnings, transfer receipts, and property income (dividends, interest, and rent) all contributed to the increase in personal income (chart 1).
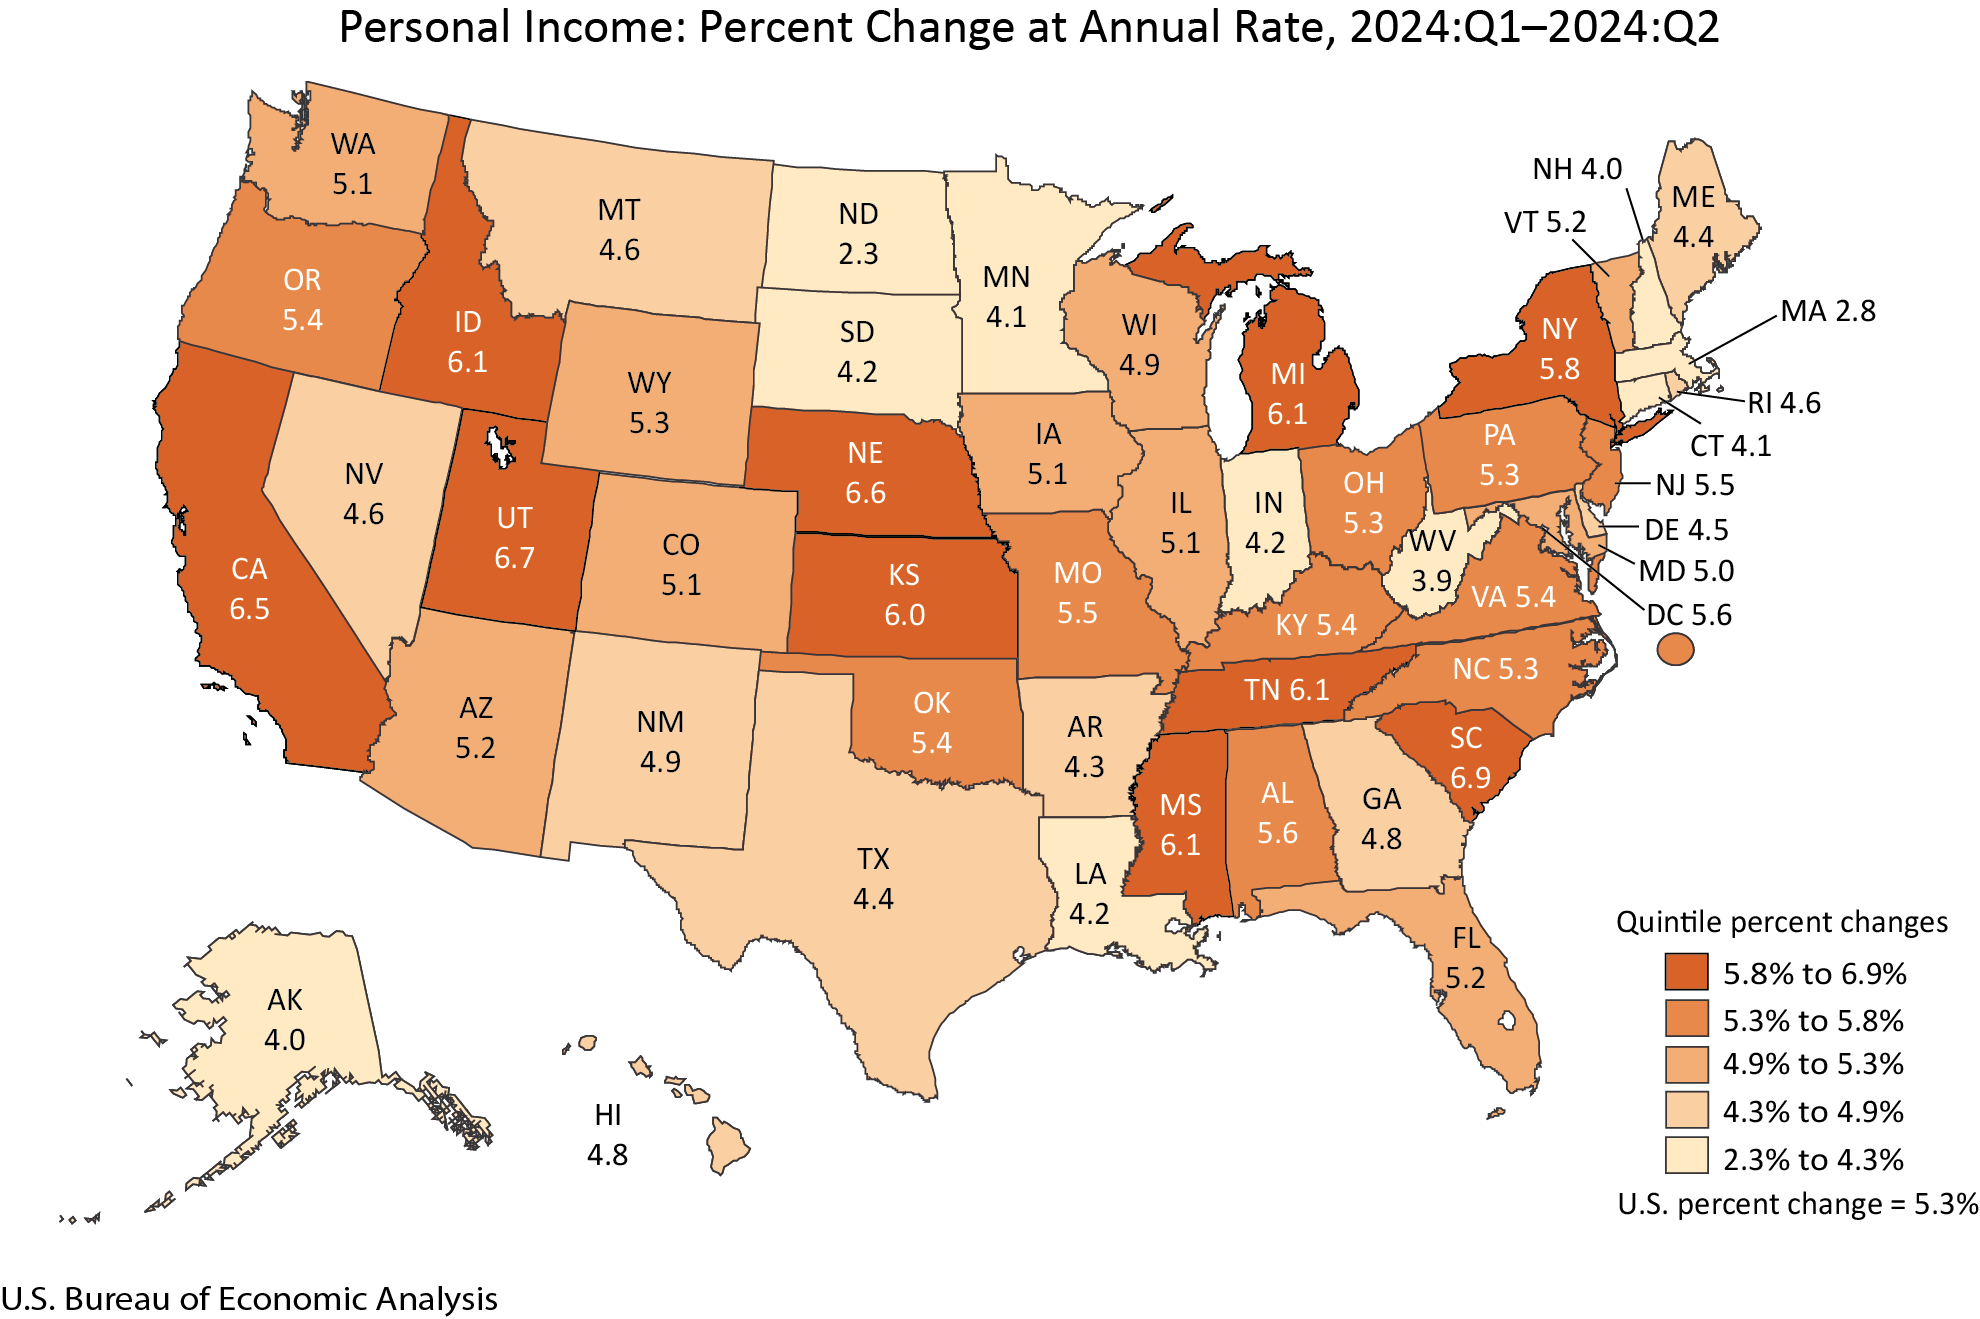
Earnings increased in all 50 states and the District of Columbia, while growing 6.3 percent nationally. The percent change in earnings ranged from 8.3 percent in Idaho to 2.1 percent in North Dakota. Earnings increased in 22 of the 24 industries for which BEA prepares quarterly estimates and was the largest contributor to growth in personal income in all 50 states and the District of Columbia (tables 4 and 5).
- In South Carolina, the state with the fastest growth in personal income, durable-goods manufacturing was the leading contributor to the increase in earnings.
- In Utah, the state with the second-fastest growth in personal income, professional, scientific, and technical services was the leading contributor to the increase in earnings.
- In Nebraska, the state with the third-fastest growth in personal income, farm earnings was the leading contributor to the increase. In contrast, farm earnings was the leading contributor to the decline in earnings in North Dakota, the state with the slowest growth in personal income.
Transfer receipts increased in 49 states and the District of Columbia, while growing 6.1 percent nationally. The percent change in transfer receipts ranged from 14.9 percent in California to –0.5 percent in Massachusetts (table 4).
- The increase in transfer receipts in California was due in part to an increase in Medicaid benefits, which increased 47.8 percent due to program expansion.
Property income increased in all 50 states and the District of Columbia, while growing 1.5 percent nationally. The percent change ranged from 2.4 percent in Wyoming to 1.0 percent in Nebraska and Mississippi (table 4).
Update of state statistics
The estimates for the second quarter of 2024 incorporate the results of BEA's annual updates of GDP and personal income by state that are also being released today. The annual estimates of GDP and personal income by state from 2019 to 2023 and quarterly estimates of GDP and personal income by state from the first quarter of 2019 through the first quarter of 2024 were revised. This update incorporates new and revised source data that are more complete and more detailed than previously available, updates to seasonal factors, and aligns the states with the annual update of the National Income and Product Accounts and the GDP by industry statistics released on September 26, 2024. Our online journal, the Survey of Current Business, will publish an article in November describing the results.
BEA released new estimates of per capita personal income for the second quarter of 2024, along with revised estimates for the first quarter of 2019 through the first quarter of 2024. BEA used U.S. Census Bureau population figures to calculate per capita personal income estimates for the first quarter of 2020 through the second quarter of 2024. For earlier estimates, BEA continues to use intercensal population statistics that it developed based on Census Bureau methodology. See “Note on Per Capita Personal Income and Population."
Starting in September 2025, BEA will begin to regularly publish quarterly GDP and personal income by state along with annual personal consumption expenditures by state together in a single news release, providing a fuller picture of the economies of all states and the District of Columbia. The combined news release will replace the publication of two separate releases issued on different days.
* * *
Next release: December 20, 2024, at 10:00 a.m. EST
Gross Domestic Product by State and Personal Income by State, 3rd Quarter 2024