
Distribution of Personal Income
Distribution of U.S. Personal Income
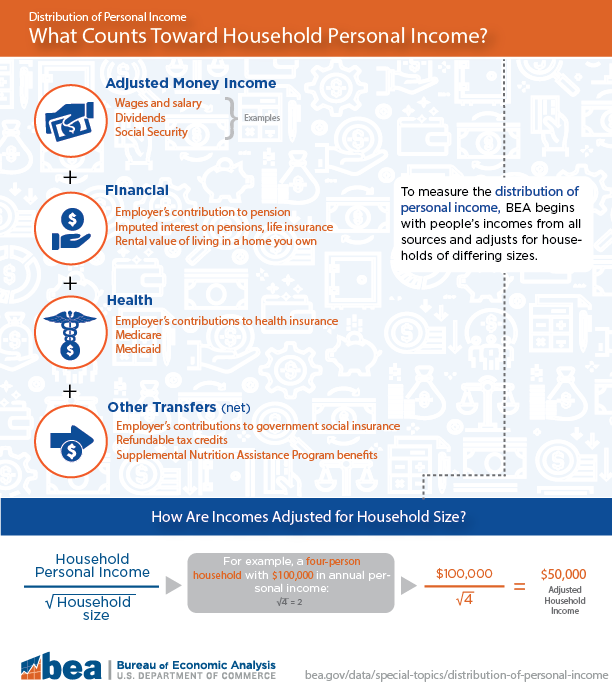
These statistics distribute the income totals in NIPA Table 2.1 to households, bridging national economic accounts and household-level data ("Technical Document: A Methodology for Distributing Personal Income"). The estimates show how major income sources contribute to household income across the distribution, and how this composition has evolved over time. Together, they provide a consistent, nationally-anchored picture of how personal income and its components flow to U.S. households (adjusted for household size), enabling comparisons both within a given year and over the full time series.
The following is the total growth in nominal personal income by quintile (2000-2024).

National Nowcast
To improve timeliness, BEA has developed an experimental nowcast for 2025 that balances user needs for relevance and accuracy. Machine learning techniques analyze relationships between published annual distributions and current NIPA totals to generate timely estimates at the quintile level. The nowcasting methodology is detailed in BEA Working Paper 2024-6, with an abridged version published in AEA Papers and Proceedings.
The following are estimates for shares (2024 and 2025) and growth of personal income (2024-2025) by quintile, as published for 2024 and nowcast for 2025:
| 2024 Share of PI (Published) |
2025 Share of PI (Nowcast) |
2025 Nominal Growth in PI (Nowcast) |
|
|---|---|---|---|
| Q1: 0-20% | 5.3 | 5.2 | 4.1% |
| Q2: 20-40% | 9.5 | 9.6 | 5.8% |
| Q3: 40-60% | 13.4 | 13.4 | 5.0% |
| Q4: 60-80% | 19.0 | 19.1 | 5.4% |
| Q5: 80-100% | 52.8 | 52.7 | 4.6% |
- The distribution of personal income release revises all previous years and provides provisional data for 2024. Given the importance of providing timely data, extrapolations were made for several income sources with unavailable data to provide distributional estimates for 2024 (provisional summary file). Because the top 1 percent and top 5 percent income shares are substantially influenced by not-yet-available Statistics of Income source data for 2024, interval ranges are provided for these estimates.
- Download the full dataset of all available years and metrics CSV
- Data for 2023 XLSX
- Provisional Data for 2024 XLSX
- Interactive Tables: Table 2.10. Distributions of Personal and Disposable Income for Households
- Income Distribution Analysis Tool (IDAT)
- Technical Document: An Updated Methodology for Distributing Personal Income PDF
- Read-me for Summary File PDF
- Summary of Methodological Updates PDF
- Infographic: Measuring the Distribution of Personal Income PDF and Image PNG
Distribution of State Personal Income
Prototype statistics showing how personal income and disposable personal income are distributed across households in each state and the District of Columbia were updated in July 2026. The release added new statistics for 2024 and updated the entire series from 2012 to 2023 based on new source data and updates in methods. These statistics build on the methodology BEA uses to estimate the national distribution of personal income. They are consistent with and complement existing BEA data on state personal income totals. Data users are invited to provide feedback on these prototype state statistics as we continue to research and make improvements.
- Includes distribution of state personal income by quintile and top/bottom 10%, 2012–2024
- Download a summary file of state distributional metrics for 2012-2024 XLSX
- Download detailed files for all states ZIP (Compressed XLSX)
- State Rankings XLSX State rankings for mean and median personal income, before and after adjusting for inflation and regional price differences.
- Summary of Methodological Updates PDF
- Income Distribution Analysis Tool (IDAT)
- Technical Document PDF This document details BEA's methodology for the prototype estimates.
- Developing Statistics on the Distribution of State Personal Income: Methodology and Preliminary Results PDF By Dirk van Duym and Christian Awuku-Budu | U.S. Bureau of Economic Analysis, May 2022
- Archive
Supplementary National Distributional Analysis
Income-Stratified PCE Price Index
The income-stratified personal consumption expenditures price index (ISPCEPX) measures inflation as experienced by households at different income levels. Because spending patterns differ across the distribution, inflation rates do as well. ISPCEPX provides the decile-specific price deflators used to compute real income growth in BEA's growth incidence curves.

- ISPCEPX XLSX
- Read-me for ISPCEPX PDF
- Rethinking inflation inequality: evidence from national accounts
By Marina Gindelsky and Robert Martin | Published online by Cambridge University Press: 16 April 2026 - Rethinking Inflation Heterogeneity: Evidence From National Accounts PDF
Growth Incidence Curve
The growth incidence curve (GIC) provides information about the evolution of income over time. A downward sloping GIC indicates that lower income households experienced faster growth than high income households.

- The GIC supplements other measures such as the Gini coefficient or the shares of personal income going to different deciles.
- Growth Incidence Curves PDF
Distribution of Personal Saving
Based on Joint Distribution of Disposable Personal Income and Personal Consumption Expenditures
To provide a fuller picture of the well-being of households, BEA and the Bureau of Labor Statistics (BLS) have collaborated to produce a distribution of personal saving, by developing a joint distribution of disposable personal income (DPI) and personal consumption expenditures (PCE).

- This is an ongoing research project. Current statistics for the distribution of personal saving and joint distribution of disposable personal income and personal consumption expenditures are provided for 2004-2023.
- Download the full dataset of all available years and metrics XLSX
- Technical Document: The Methodology for Distributing Personal Saving via a Joint Distribution of Disposable Personal Income and Personal Consumption Expenditures PDF
- Read-me for Summary File PDF
Internationally Comparable Statistics
A series of internationally comparable research statistics has been provided that follow the guidance of the Organization for Economic Cooperation and Development (OECD) Expert Group on Disparities in a National Accounts framework (EG DNA).

- An updated series of internationally comparable research statistics has been provided for the same years (2000-2023+ provisional 2024), following the same structure as the BEA distribution of personal income tables.
- Download the full OECD dataset of all available years and metrics CSV
- OECD Technical Document: An Internationally Comparable Methodology PDF
- Read-me for OECD Summary File PDF
- Innovations in Distribution of Income Statistics: New Data and a New Tool
- New Statistics Show Distribution of Personal Income Within States
- New Statistics Measure How Personal Income Is Distributed
- How households share in an economy's growthBy Dennis J. Fixler | Economic Statistics Centre of Excellence, August 2019
- Rethinking Inflation Heterogeneity: Evidence From National Accounts By Marina Gindelsky and Robert Martin | U.S. Bureau of Economic Analysis, August 2025.
- Nowcasting Distributional National Accounts for the United States: A Machine Learning Approach By Marina Gindelsky and Gary Cornwall | U.S. Bureau of Economic Analysis, September 2024. Published in AEA Papers and Proceedings, May 2025.
- Developing Statistics on the Distribution of State Personal Income: Methodology and Preliminary Results By Dirk van Duym and Christian Awuku-Budu | U.S. Bureau of Economic Analysis, May 2022
- The Feasibility of a Quarterly Distribution of Personal Income By Dennis Fixler, Marina Gindelsky, and Robert Kornfeld | U.S. Bureau of Economic Analysis, December 2021
- Distributing Personal Income: Trends Over Time By Dennis Fixler, Marina Gindelsky, and David Johnson | National Bureau of Economic Research, March 2020
- Improving the Measure of the Distribution of Personal IncomeBy Dennis J. Fixler, Marina Gindelsky, and David S. Johnson | BEA Paper, February 2019. Published in AEA Papers and Proceedings, May 2019.
- A Consistent Data Series to Evaluate Growth and Inequality in the National Accountsby Dennis J. Fixler, David S. Johnson, Andrew Craig, and Kevin Furlong | Review of Income and Wealth, November 2017
- Toward National and Regional Distributions of Personal Income PDFby Dennis J. Fixler, David S. Johnson, Andrew Craig, and Kevin J. Furlong | SCB, March 2017
- Accounting for the Distribution of Income in the U.S. National Accountsby Dennis J. Fixler and David S. Johnson | Measuring Economic Sustainability and Progress, 2014
On This Page
What is Distribution of Personal Income?
Measures how households are sharing in the U.S. economy's growth. Shows how total personal income in the United States is distributed across households.
Contact Personnel
-
TechnicalUS Distribution of Personal Income
-
State DataDistribution of State Personal Income
-
IDATIan Schaaf
-
News MediaConnie O'Connell
-
CongressionalThomas Dail