
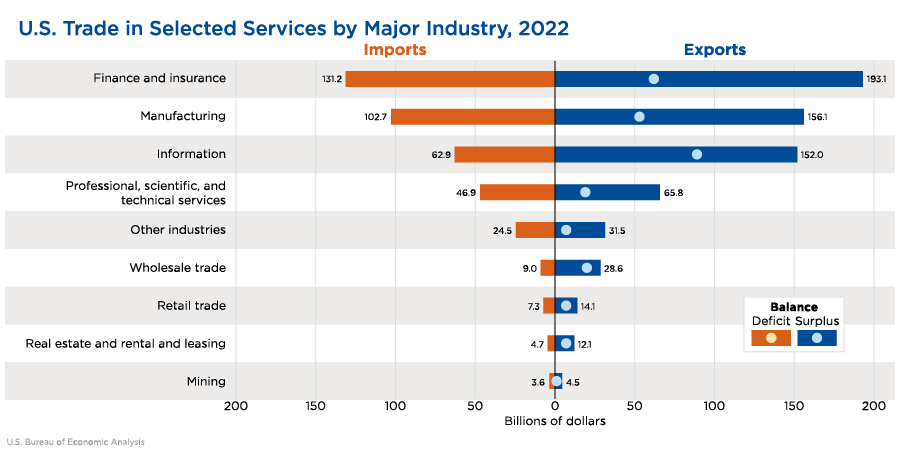
U.S. firms in the finance and insurance sector led both U.S. exports and imports of services in 2022, according to a new Bureau of Economic Analysis article that presents a profile of companies that export and/or import services. While BEA regularly publishes statistics on all U.S. services trade, the profile focuses on a subset of services referred to in the article as “selected services.” These selected services are collected on BEA surveys and account for a major portion of all U.S. services trade. Finance and insurance firms’ combined exports and imports of selected services totaled $324.3 billion in 2022.
The full set of selected services explored in the article are: construction; insurance services; financial services; charges for the use of intellectual property; telecommunications, computer, and information services; other business services; and personal, cultural, and recreational services.
Manufacturing firms were the second largest services traders, with combined exports and imports totaling $258.7 billion. Although their primary activity is goods production, manufacturing firms also are large exporters and importers of services, especially for charges for the use of intellectual property, professional and management consulting services, and research and development services.
The surplus on trade in selected services ($264.9 billion) was larger than the overall U.S. surplus on trade in services ($231.8 billion) in 2022.
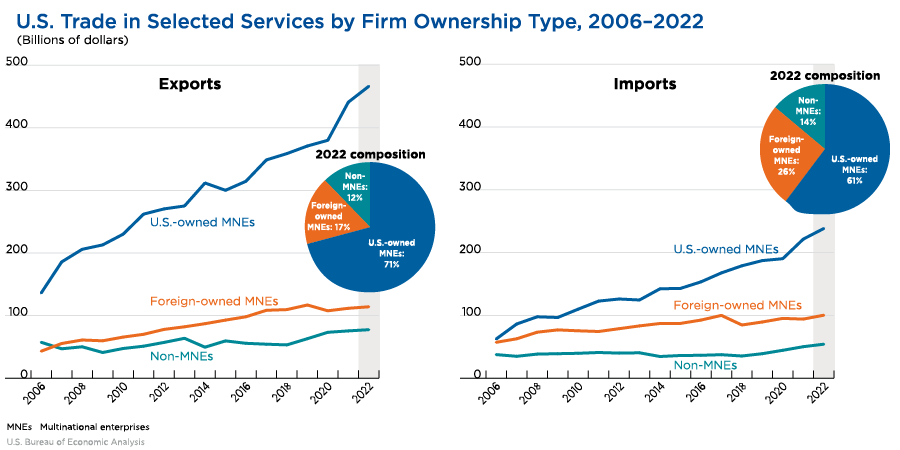
The analysis is part of a new article in BEA’s Survey of Current Business, which presents a profile of U.S. international services traders for 2006-2022, focusing on 2021 and 2022. The article is the newest in a series featuring services trade by enterprise characteristics (STEC) statistics, presenting, for a subset of international services categories, detail beyond what is covered in the standard international services statistics.
The STEC statistics are based on a data set constructed by linking BEA’s trade in services surveys with its surveys of multinational enterprises (MNEs). The statistics cover trade in the selected services identified above. Because MNEs, especially U.S.-owned MNEs, account for such a large proportion of services trade, the linked data provide considerable insight into the nature of firms that are services traders. The STEC statistics feature information on various characteristics of U.S. firms that trade services, such as the primary industry of firm activity, firm ownership type, and employment size class.
With the release of this article, BEA also expanded the offering of STEC statistics in its interactive data tables, introducing two new tables, which feature expanded detail by industry and a cross-classification by employment size class and service type, and extending coverage to 2006-2022.
For more information, read A Profile of U.S. Services Traders, 2006-2022.