
News Release
Revised Statistics of Gross Domestic Product by Industry, 2009-2011
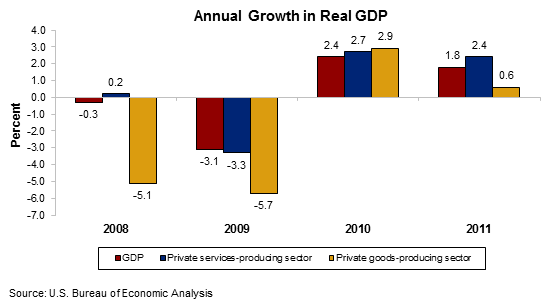
Retail trade and durable goods manufacturing were the leading contributors to the deceleration in U.S. economic growth in 2011, according to revised statistics on the breakout of real gross domestic product (GDP) by industry from the Bureau of Economic Analysis. Real GDP growth slowed in 2011, increasing 1.8 percent after increasing 2.4 percent in 2010. The revised statistics do not change the general picture of the economy: 12 of 22 industry groups contributed to the slowdown in real GDP.
- Retail trade real value added—a measure of an industry’s contribution to GDP—rose 0.2 percent in 2011, after increasing 7.0 percent in 2010.
- Durable goods manufacturing increased 6.8 percent, after increasing 13.3 percent in 2010, primarily reflecting a slowdown in computer and electronic products manufacturing.
- Nondurable goods manufacturing turned down in 2011, decreasing 2.1 percent after increasing 0.4 percent in 2010, primarily reflecting a downturn in food, beverage, and tobacco manufacturing.
Prices:
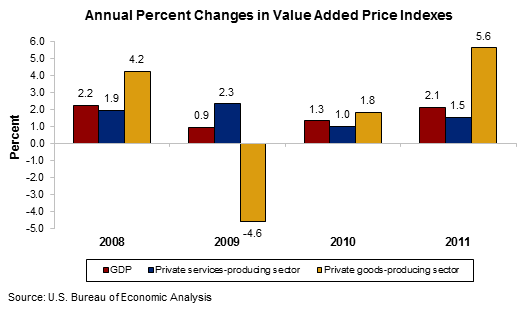
Value added prices accelerated in 2011, increasing 2.1 percent after increasing 1.3 percent in 2010. Nondurable goods manufacturing and retail trade were the largest contributors to the acceleration in the GDP price index for 2011. Value added prices measure changes in an industry’s unit costs of capital and labor inputs and reflect the productivity of capital and labor used by the industry.
- Value added prices for the goods-producing sector accelerated in 2011, increasing 5.6 percent after increasing 1.8 percent in 2010. Value added prices for the services-producing sector also accelerated, increasing 1.5 percent after increasing 1.0 percent in 2010.
- Value added prices for nondurable goods manufacturing accelerated in 2011, increasing 9.8 percent after increasing 1.0 percent in 2010, reflecting an acceleration in petroleum and coal products manufacturing.
- Value added prices for retail trade turned up in 2011, increasing 3.2 percent after decreasing 3.3 percent in 2010, reflecting an upturn in retail margin prices.
Other highlights:
- Overall, 15 of 22 industry groups contributed to the increase in real GDP. Durable goods manufacturing—reflecting strong growth in motor vehicle manufacturing, and professional, scientific and technical services were the leading contributors to growth.
- Manufacturing’s current-dollar share of GDP increased for the second consecutive year, to 11.5 percent, its highest share since 2007.
- Professional, scientific, and technical services, which include accounting and payroll services and management, scientific, and technical consulting services, increased 5.4 percent in 2011, after increasing 2.6 percent in 2010.
Summary of Revisions of the Annual Industry Accounts
The estimates released today reflect the regular annual revision of the annual industry accounts for 2009-2011. Annual revisions incorporate source data that are more complete, more detailed, and otherwise more reliable than those previously available. Revisions primarily reflected the incorporation of newly available and revised annual source data (e.g., Census’s Annual Survey of Manufactures and the Department of Treasury’s Statistics of Income). Compared to the previously published statistics, the overall picture of the economy for 2009-2011 did not change.
- In 2011, the direction of growth in real value added was unchanged for 14 of the 22 industry groups. Four of the top-five industry group contributors to the deceleration in real GDP remained in the top-five and seven of the top-10 contributors to the increase in real GDP remained in the top-10.
- In 2010, the direction of growth in real value added was unchanged for 19 of the 22 industry groups. Nine of the top-10 industry group contributors to the upturn in real GDP remained in the top-10 and six of the top-10 contributors to the increase in real GDP remained in the top-10.
- In 2009, the direction of growth in real value added was unchanged for 21 of the 22 industry groups. All of the top-five contributors to the larger decrease in real GDP remained in the top-five.
Revisions to real value added reflect revisions to real gross output and real intermediate inputs. A new table presenting revisions in percent changes in real gross output, real intermediate inputs, and real value added by industry group has been added to this release in order to better illustrate the relationship between these three measures (table 6). In most instances, changes in real value added are largely consistent with changes in real gross output.
More detailed Annual Industry Accounts statistics are available on BEA’s website at www.bea.gov/industry. Additional information on this revision will be available in an article in the December 2012 issue of the Survey of Current Business.
BEA’s national, international, regional, and industry estimates; the Survey of Current Business; and BEA news releases are available without charge on BEA’s Web site at www.bea.gov. By visiting the site, you can also subscribe to receive free e-mail summaries of BEA releases and announcements.
Advance statistics of gross domestic product (GDP) by industry for 2012 will be released on April 25, 2013 at 8:30 A.M. EDT.