News Release
Gross Domestic Product for the Commonwealth of the Northern Mariana Islands, 2021 and 2022
Gross Domestic Product by Industry and Compensation by Industry, 2020 and 2021
Real gross domestic product for the Commonwealth of the Northern Mariana Islands increased 16.7 percent in 2022 and 5.1 percent in 2021 after decreasing 29.1 percent in 2020, according to statistics released today by the U.S. Bureau of Economic Analysis (table 1.3). These statistics were developed under the Statistical Improvement Program funded by the Office of Insular Affairs of the U.S. Department of the Interior.
Gross domestic product for 2022
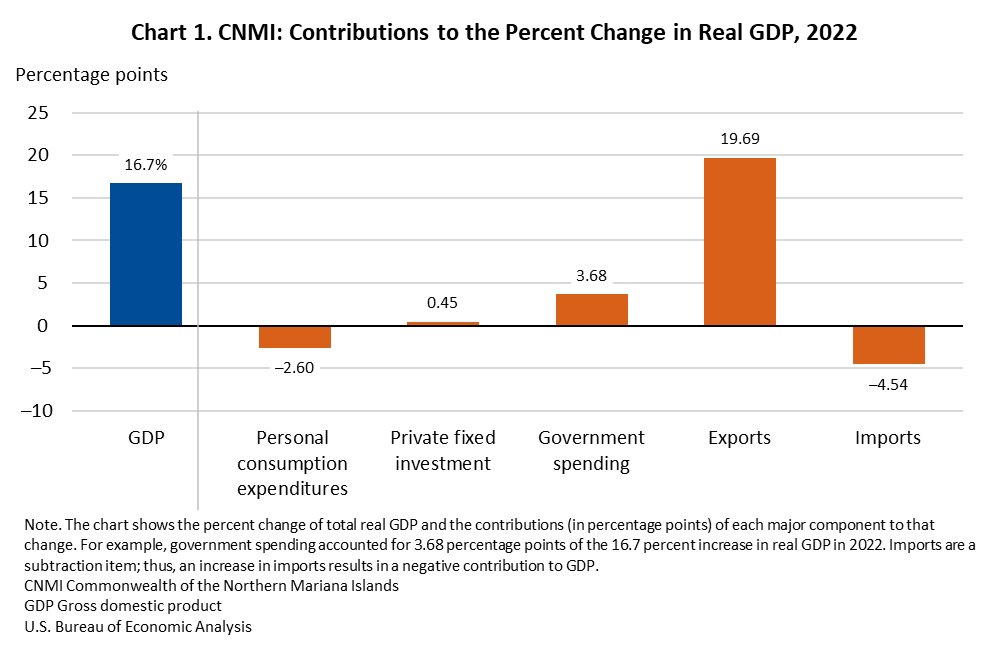
The growth in real gross domestic product (GDP) from 2021 to 2022 reflected increases in exports, government spending, and private fixed investment (chart 1). These increases were partly offset by a decrease in personal consumption expenditures (PCE). Imports, a subtraction item in the calculation of GDP, increased.
Exports increased 324.9 percent (table 1.3). The increase in exports was accounted for by exports of services, which consists primarily of visitor spending (table 1.4). Visitor arrivals increased 656.4 percent in 2022 according to statistics published by the Commonwealth of the Northern Mariana Islands (CNMI) government.
Government spending increased 4.7 percent, reflecting increases in both territorial and federal government spending.
- Territorial government spending increased 3.3 percent, supported by federal grants, including Coronavirus State and Local Fiscal Recovery Funds payments and Education Stabilization Fund payments authorized by the Coronavirus Aid, Relief, and Economic Security (CARES) Act of 2020; the Coronavirus Response and Relief Supplemental Appropriations (CRRSA) Act of 2021; and the American Rescue Plan Act of 2021.
- Federal government spending increased 22.8 percent. The increase reflected construction spending associated with the U.S. Air Force’s Tinian Divert Airfield project.
Private fixed investment increased 3.8 percent, primarily reflecting an increase in business spending on equipment.
Personal consumption expenditures decreased 3.3 percent, reflecting an increase in consumer prices (table 1.5) that outpaced the increase in current-dollar PCE (table 1.1).
GDP for 2021
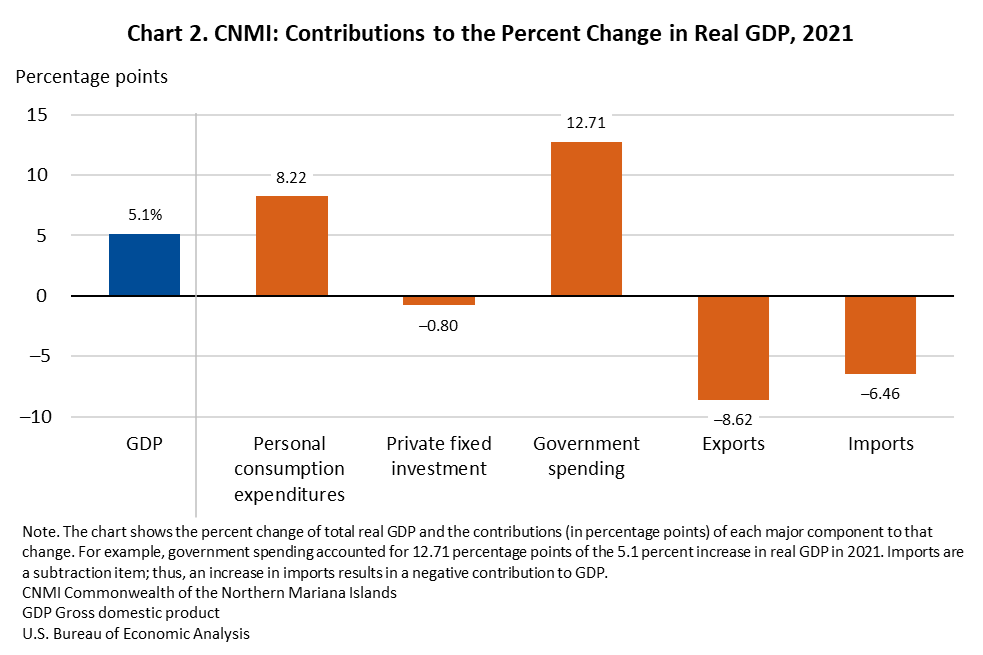
The growth in real GDP from 2020 to 2021 reflected increases in government spending and personal consumption expenditures (chart 2). These increases were partly offset by declines in exports and private fixed investment. Imports, a subtraction item in the calculation of GDP, increased.
Government spending increased 19.2 percent, reflecting increases in both territorial and federal government spending.
- Territorial government spending increased 19.9 percent, supported by federal grants, including Coronavirus Relief Fund payments and Education Stabilization Fund payments authorized by the CARES Act and the American Rescue Plan Act.
- Federal government spending increased 11.2 percent, primarily reflecting an increase in federal reconstruction activities related to Typhoon Yutu.
Personal consumption expenditures increased 11.1 percent, supported by government assistance payments distributed to households through the CRRSA Act and the American Rescue Plan Act.
Exports decreased 58.1 percent. The decrease in exports was accounted for by exports of services, which consists primarily of visitor spending. Visitor arrivals decreased 85.7 percent in 2021 according to statistics published by the CNMI government.
Private fixed investment decreased 6.4 percent, reflecting a decline in business spending on structures and equipment.
GDP by industry and compensation by industry for 2021
In 2021, real GDP increased 5.1 percent. The government sector was the primary contributor to the increase, according to the newly available GDP by industry data (table 2.5).
The government sector increased 13.2 percent, primarily reflecting growth in compensation of territorial government employees (table 2.4).
The private sector increased 0.6 percent, reflecting an increase in “other private industries,” such as professional services and construction. The increase was partly offset by a decline in accommodations, food services, and amusement. As noted above, the number of visitor arrivals to the CNMI decreased 85.7 percent in 2021.
Total compensation increased from $578 million in 2020 to $604 million in 2021 (table 2.6). The $26 million increase was mostly accounted for by an increase in territorial government compensation.
GDP by industry and compensation by industry for 2020
In 2020, real GDP decreased 29.1 percent. The private sector was the primary contributor to the decline, according to the newly available GDP by industry data.
The private sector decreased 40.6 percent, reflecting widespread declines as businesses throughout the CNMI operated at a reduced capacity due to the COVID–19 pandemic. Visitor arrivals declined 81.7 percent in 2020 according to statistics published by the CNMI government. Additionally, casino gambling revenue dropped over 95 percent in 2020 according to publicly available financial statements.
The government sector increased 9.7 percent, primarily reflecting a reduction in the operating losses of government utilities, whose expenditures returned to normal levels following several years of elevated spending in the aftermath of Typhoon Yutu.
Total compensation decreased from $701 million in 2019 to $578 million in 2020. The $123 million decrease reflected widespread declines in private-sector compensation including accommodations, food services, and amusement, other private industries, and wholesale and retail trade.
Updates to GDP and its components
Estimates for 2018–2020 that were released on January 31, 2023, have been revised to incorporate updates to source data, including the following:
- financial statements for fiscal year 2021 for the CNMI government and its independent agencies,
- tabulations of imports of goods by type provided by CNMI Customs,
- tabulations of business revenues data provided by the CNMI Department of Finance, and
- federal government contract obligations data from the U.S. General Services Administration Federal Procurement Data System.
The revised estimates exhibit a pattern of inflation-adjusted GDP growth similar to the previously published estimates (table 1.7).
Due to lags in the availability of data for various components of GDP, the statistics presented today for 2022 are preliminary estimates. In particular, the estimates of territorial government spending are based on very limited information. As of November 2024, the CNMI government-wide audited financial statements were not available for fiscal year 2022 or 2023. In the absence of these key data sources on government spending, BEA used alternative methods to estimate expenditures, including:
- residually estimating payroll by extrapolating total wages and subtracting estimates of private-sector wages and
- assuming inflation-adjusted intermediate purchases of goods and services, equipment investment, and depreciation expenses were unchanged from calendar year 2021.
For more information on the data sources underlying these estimates, see Summary of Methodologies: Gross Domestic Product for American Samoa, the Commonwealth of the Northern Mariana Islands, Guam, and the U.S. Virgin Islands.
The annual publication of BEA’s GDP statistics for the CNMI is made possible through funding by the Office of Insular Affairs (OIA) of the U.S. Department of the Interior. OIA has paused funding of this work to conduct an exploratory assessment of territorial source data with the goal of informing how to strategically invest in and support the CNMI's economic statistics into the future. Without funding, BEA is pausing the production of GDP statistics for the CNMI. When funding and improved data sources become available, BEA plans to resume production of these statistics.
Archived GDP statistics for the CNMI will continue to be available on BEA’s website.

