
News Release
Gross Domestic Product (Third Estimate), Corporate Profits (Revised Estimate), and GDP by Industry, Second Quarter 2024 and Annual Update
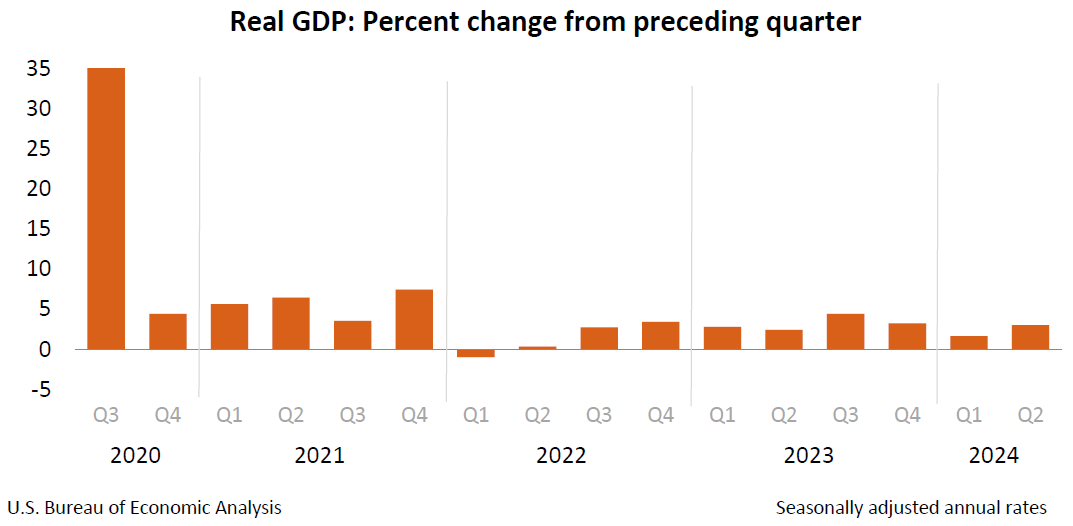
Real gross domestic product (GDP) increased at an annual rate of 3.0 percent in the second quarter of 2024 (table 1), according to the "third" estimate released by the U.S. Bureau of Economic Analysis. In the first quarter, real GDP increased 1.6 percent (revised).
The GDP estimate released today is based on more complete source data than were available for the "second" estimate issued last month. In the second estimate, the increase in real GDP was also 3.0 percent. The update primarily reflected upward revisions to private inventory investment and federal government spending that were offset by downward revisions to nonresidential fixed investment and exports (refer to "Updates to GDP"). Imports, which are a subtraction in the calculation of GDP, were revised up.
The increase in real GDP primarily reflected increases in consumer spending, private inventory investment, and nonresidential fixed investment. Imports increased (table 2).
Compared to the first quarter, the acceleration in real GDP in the second quarterly primarily reflected an upturn in private inventory investment and an acceleration in consumer spending. These movements were partly offset by a downturn in residential fixed investment.
Current‑dollar GDP increased 5.6 percent at an annual rate, or $392.6 billion, in the second quarter to a level of $29.02 trillion, a $9.5 billion larger increase than the previous estimate (tables 1 and 3). More information on the source data that underlie the estimates is available in the "Key Source Data and Assumptions" file on BEA’s website.
The price index for gross domestic purchases increased 2.4 percent in the second quarter, the same as the previous estimate (table 4). The personal consumption expenditures (PCE) price index increased 2.5 percent, the same as the previous estimate. Excluding food and energy prices, the PCE price index increased 2.8 percent, also the same as the previous estimate.
Personal Income
Current-dollar personal income increased $315.7 billion in the second quarter, an upward revision of $82.1 billion from the previous estimate. The increase primarily reflected increases in compensation and personal current transfer receipts (table 8).
Disposable personal income increased $260.4 billion, or 5.0 percent, in the second quarter, an upward revision of $77.3 billion from the previous estimate. Real disposable personal income increased 2.4 percent, an upward revision of 1.4 percentage points.
Personal saving was $1.13 trillion in the second quarter, an upward revision of $74.3 billion from the previous estimate. The personal saving rate—personal saving as a percentage of disposable personal income—was 5.2 percent in the second quarter, compared with 5.4 percent (revised) in the first quarter.
Gross Domestic Income and Corporate Profits
Real gross domestic income (GDI) increased 3.4 percent in the second quarter, an upward revision of 2.1 percentage points from the previous estimate. The average of real GDP and real GDI, a supplemental measure of U.S. economic activity that equally weights GDP and GDI, increased 3.2 percent in the second quarter, an upward revision of 1.1 percentage points from the previous estimate (table 1).
Profits from current production (corporate profits with inventory valuation and capital consumption adjustments) increased $132.5 billion in the second quarter, an upward revision of $74.9 billion from the previous estimate (table 10).
Profits of domestic financial corporations increased $42.5 billion in the second quarter, a downward revision of $4.0 billion from the previous estimate. Profits of domestic nonfinancial corporations increased $108.8 billion, an upward revision of $79.6 billion. Rest-of-the-world profits decreased $18.8 billion, a downward revision of $0.7 billion. In the second quarter, receipts increased $4.4 billion, and payments increased $23.1 billion.
Updates to GDP
With the third estimate, upward revisions to private inventory investment and federal government spending were offset by downward revisions to nonresidential fixed investment, exports, consumer spending, and residential fixed investment. Imports were revised up. For more information, refer to the Technical Note. For information on updates to GDP, refer to the "Additional Information" section that follows.
| Advance Estimate | Second Estimate | Third Estimate | |
|---|---|---|---|
| (Percent change from preceding quarter) | |||
| Real GDP | 2.8 | 3.0 | 3.0 |
| Current-dollar GDP | 5.2 | 5.5 | 5.6 |
| Real GDI | … | 1.3 | 3.4 |
| Average of Real GDP and Real GDI | … | 2.1 | 3.2 |
| Gross domestic purchases price index | 2.3 | 2.4 | 2.4 |
| PCE price index | 2.6 | 2.5 | 2.5 |
| PCE price index excluding food and energy | 2.9 | 2.8 | 2.8 |
Real GDP by Industry
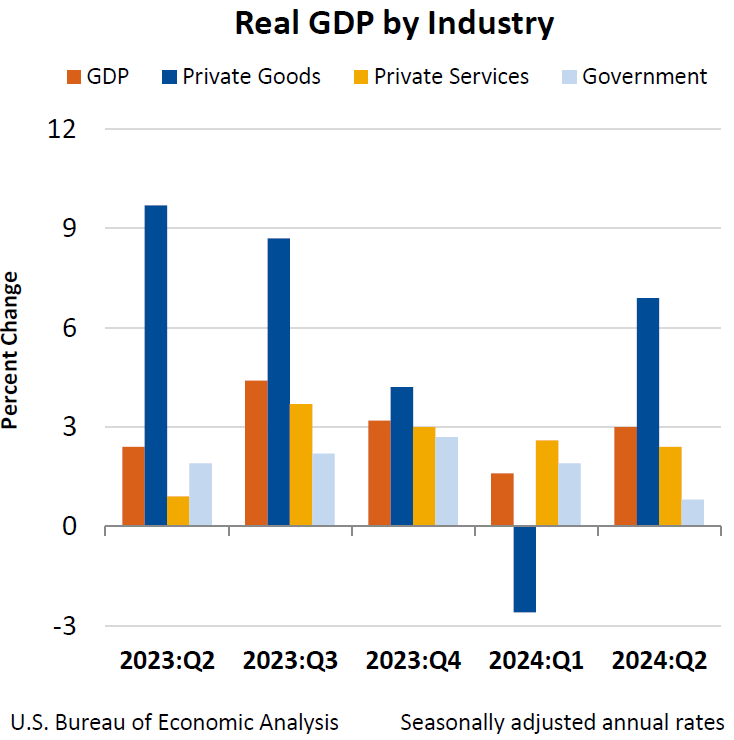
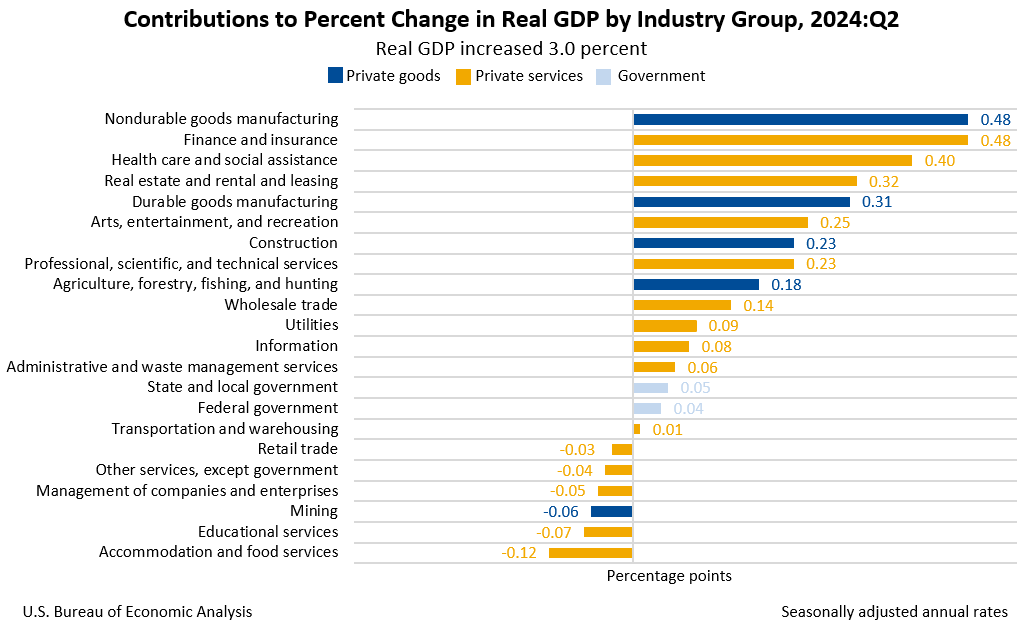
Today’s release includes estimates of GDP by industry, or value added—a measure of an industry’s contribution to GDP. Private goods-producing industries increased 6.9 percent, private services-producing industries increased 2.4 percent, and government increased 0.8 percent (table 12). Overall, 16 of 22 industry groups contributed to the second-quarter increase in real GDP.
- Within private goods-producing industries, the leading contributors to the increase were nondurable goods manufacturing (led by petroleum and coal products) and durable goods manufacturing (led by motor vehicles, bodies and trailers, and parts) (table 13).
- Within private services-producing industries, the leading contributors to the increase were finance and insurance (led by Federal Reserve banks, credit intermediation, and related activities); health care and social assistance (led by ambulatory health care services); as well as real estate and rental and leasing (led by real estate).
- The increase in government reflected increases in state and local government as well as federal government.
Gross Output by Industry
Real gross output—principally a measure of an industry’s sales or receipts, which includes sales to final users in the economy (GDP) and sales to other industries (intermediate inputs)—increased 1.8 percent in the second quarter. This reflected an increase of 2.1 percent for private goods-producing industries, an increase of 1.7 percent for private services-producing industries, and an increase of 2.2 percent for government (table 16). Overall, 18 of 22 industry groups contributed to the increase in real gross output.
Annual Update of the National Economic Accounts
Today’s release presents results from the annual update of the National Economic Accounts (NEAs), which include the National Income and Product Accounts (NIPAs) and the Industry Economic Accounts (IEAs). The update includes revised estimates for the first quarter of 2019 through the first quarter of 2024 and resulted in revisions to GDP, GDP by industry, GDI, and their major components. The reference year remains 2017.
With today's release, most data are available through BEA’s Interactive Data application on the BEA website (www.bea.gov). Refer to “Information on 2024 Annual Updates to the National, Industry, and State and Local Economic Accounts” for the complete table release schedule and a summary of results through 2023, which includes information on methodology changes. A table showing the major current dollar revisions and their sources for each component of GDP, national income, and personal income is also provided. An article describing the update in more detail will be forthcoming in the Survey of Current Business.
The updated estimates show that real GDP increased at an average annual rate of 2.3 percent from 2018 to 2023, 0.2 percentage point higher than the previously published estimate. Over the same period, real GDI increased at an average annual rate of 2.2 percent, 0.4 percentage point higher than previously published. The average of real GDP and real GDI over the same period was 2.3 percent, 0.4 percentage point higher than previously published.
For the period of economic expansion from the second quarter of 2009 through the fourth quarter of 2019, real GDP increased at an annual rate of 2.5 percent, revised up 0.1 percentage point from the previously published estimates. For the period of economic contraction from the fourth quarter of 2019 through the second quarter of 2020, real GDP decreased at an annual rate of 17.5 percent, the same as previously estimated. For the period of economic expansion from the second quarter of 2020 through the first quarter of 2024, real GDP increased at an annual rate of 5.2 percent, 0.3 percentage point higher than previously estimated.
Previously published estimates, which are superseded by today's release, are found in BEA’s archives.
Updates for the First Quarter of 2024
For the first quarter of 2024, real GDP is now estimated to have increased 1.6 percent (table 1), an upward revision of 0.2 percentage point from the previously published estimate, primarily reflecting an upward revision to consumer spending that was partly offset by downward revisions to private inventory investment and residential fixed investment.
The price index for gross domestic purchases is now estimated to have increased 3.0 percent, a downward revision of 0.1 percentage point. The PCE price index increased 3.4 percent, the same as previously published. Excluding food and energy, the PCE price index increased 3.7 percent, the same as previously published.
| First Quarter 2024 | ||
|---|---|---|
| Previous Estimate | Revised | |
| (Percent change from preceding quarter) | ||
| Real GDP | 1.4 | 1.6 |
| Current-dollar GDP | 4.5 | 4.7 |
| Real GDI | 1.3 | 3.0 |
| Average of Real GDP and Real GDI | 1.4 | 2.3 |
| Gross domestic purchases price index | 3.1 | 3.0 |
| PCE price index | 3.4 | 3.4 |
| PCE price index excluding food and energy | 3.7 | 3.7 |
Personal Income
Current-dollar personal income is now estimated to have increased $536.4 billion in the first quarter, an upward revision of $139.6 billion from the previous estimate. The revision primarily reflected an upward revision to compensation (led by private wages and salaries) (table 8).
Disposable personal income increased $465.1 billion, or 9.2 percent, in the first quarter, an upward revision of $224.9 billion from the previous estimate. Real disposable personal income increased 5.6 percent, an upward revision of 4.3 percentage points.
Personal saving was $1.15 trillion in the first quarter, an upward revision in change of $188.3 billion. The personal saving rate—personal saving as a percentage of disposable personal income—was 5.4 percent (revised) in the first quarter.
Gross Domestic Income and Corporate Profits
Real GDI is now estimated to have increased 3.0 percent in the first quarter (table 1); in the previously published estimates, first-quarter GDI was estimated to have increased 1.3 percent. The leading contributor to the upward revision was compensation, based primarily on new first-quarter wage and salary estimates from the Bureau of Labor Statistics’ Quarterly Census of Employment and Wages. The average of real GDP and real GDI is now estimated to have increased 2.3 percent in the first quarter; in the previously published estimates, the average of GDP and GDI was estimated to have increased 1.4 percent.
Profits from current production (corporate profits with inventory valuation and capital consumption adjustments) is now estimated to have decreased $65.1 billion in the first quarter, a downward revison of $18.0 billion (table 10).
Profits of domestic financial corporations increased $57.4 billion, a downward revision of $7.6 billion. Profits of domestic nonfinancial corporations decreased $124.9 billion, a downward revision of $10.4 billion. Rest-of-the-world profits increased $2.3 billion, the same as previously estimated. In the first quarter, receipts are now estimated to have increased $25.7 billion, and payments are estimated to have increased $23.4 billion.
GDP by Industry
In the first quarter, real value added for private goods-producing industries is now estimated to have decreased 2.6 percent, a downward revision of 1.5 percentage points. Private services-producing industries increased 2.6 percent, an upward revision of 0.7 percentage point. Government increased 1.9 percent, a downward revision of 0.4 percentage point.
Real gross output is now estimated to have increased 2.8 percent, an upward revision of 0.3 percentage point. Private goods-producing industries increased 1.6 percent, an upward revision of 0.4 percentage point. Private services-producting industries increased 3.3 percent, an upward revision of 0.2 percentage point. Government increased 2.3 percent, an upward revision of 0.6 percentage point.
* * *
Next release, October 30, 2024, at 8:30 a.m. EDT
Gross Domestic Product, Third Quarter 2024 (Advance Estimate)
* * *