
News Release
Gross Domestic Product for the U.S. Virgin Islands, 2022
Gross Domestic Product by Industry and Compensation by Industry, 2021
Real gross domestic product (GDP) for the U.S. Virgin Islands (USVI) decreased 1.3 percent in 2022 after increasing 3.7 percent in 2021 (table 1.3), according to statistics released today by the U.S. Bureau of Economic Analysis (BEA). These statistics were developed under the Statistical Improvement Program funded by the Office of Insular Affairs of the U.S. Department of the Interior.
GDP for 2022
The decrease in real GDP reflected declines in exports, private fixed investment, government spending, and personal consumption expenditures that were partly offset by an increase in inventory investment (chart 1). Imports, a subtraction item in the calculation of GDP, decreased.
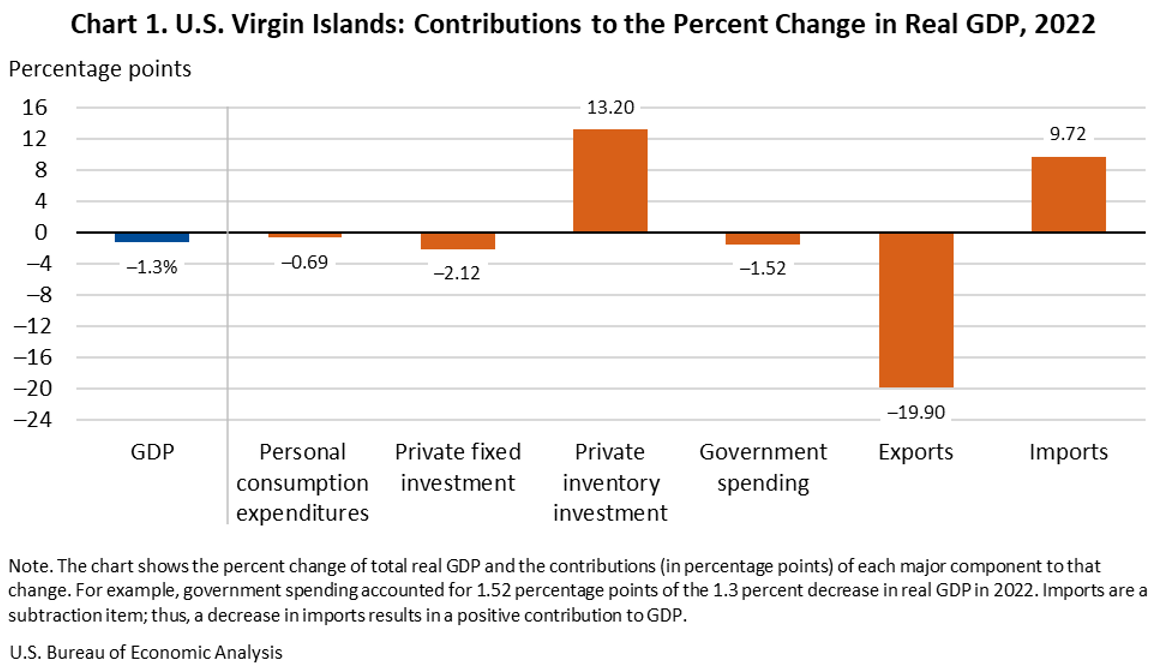
Exports of goods and services decreased 18.9 percent (table 1.3), reflecting a decrease in exports of goods that was partly offset by an increase in exports of services. The decline in exports of goods primarily reflected decreases in exports of crude oil and petroleum products. The increase in exports of services primarily reflected growth in spending by visitors. Total visitor arrivals increased 69.7 percent in 2022 according to information published by the USVI government.
Private fixed investment decreased 18.6 percent (table 1.3), reflecting declines in spending on equipment and structures. Investment spending continued to decline after being elevated in prior years to support capital improvement projects including the restart of the oil refinery on St. Croix.
Government spending decreased 4.4 percent (table 1.3), reflecting declines in territorial and federal government spending. Territorial government spending decreased 2.6 percent, reflecting a decline in construction activity. Federal government spending continued to decline in 2022 after being elevated in prior years to support reconstruction activities following the 2017 hurricanes.
Personal consumption expenditures (PCE) decreased 1.0 percent (table 1.3), reflecting an increase in consumer prices (table 1.5) that outpaced the increase in current-dollar PCE (table 1.1).
Private inventory investment increased reflecting a smaller decline in private inventories (table 1.2), due to a smaller drawdown in crude oil and petroleum product inventories compared to 2021.
GDP by industry and compensation by industry for 2021
In 2021, real GDP increased 3.7 percent. The newly available GDP by industry data, which are released on a 1-year lag, reveal that the private sector was the source of growth in real GDP in 2021 (table 2.5).
The increase in the private sector reflected growth in services-producing industries that was partly offset by a decline in goods-producing industries. Services-producing industries increased 10.9 percent (table 2.4). The largest source of growth within services-producing industries was accommodation and food services, reflecting an increase in visitor spending. Goods-producing industries decreased 13.8 percent, reflecting a decline in construction activity.
The government sector decreased 5.4 percent (table 2.4), primarily reflecting operating losses of government utilities and a decrease in territorial government employment.
Total compensation decreased from $2,546 million in 2020 to $2,306 million in 2021 (table 2.6). The $240 million decrease reflected a decrease in private-sector compensation. The largest contributor to the decrease was goods-producing industries.
Estimates for 2018–2021 that were released on May 22, 2023, have been revised to incorporate updates to source data including the following:
- Newly available draft and audited financial statements for the Government of the USVI and its independent agencies
- Updated consumer price indexes for 2020 and 2021 from the Virgin Islands Bureau of Economic Research
- Revised data on shipments from the joint U.S. Census Bureau and BEA “International Trade in Goods and Services” (FT900) report
Due to lags in the availability of data for various components of GDP, the statistics presented today for 2022 are preliminary estimates. As of April 2024, most of the USVI government's fiscal year 2022 audited financial statements were unavailable. In place of these financial statements, BEA used information from a variety of alternate data sources including USVI government budget documents, unaudited financial statements, reports on federal grant expenditures and disaster recovery progress, hospital cost reports from the Centers for Medicare & Medicaid Services, and the USVI government's Open Finance database, which includes checkbook-level spending by the primary government.
For more information on the data sources underlying these estimates, see Summary of Methodologies: Gross Domestic Product for American Samoa, the Commonwealth of the Northern Mariana Islands, Guam, and the U.S. Virgin Islands.
The annual publication of BEA’s GDP statistics for the USVI is made possible through funding by the Office of Insular Affairs (OIA) of the U.S. Department of the Interior. OIA has paused funding of this work to conduct an exploratory assessment of territorial source data with the goal of informing how to strategically invest in and support the USVI's economic statistics into the future. Without funding, BEA is pausing the production of GDP statistics for the USVI. When funding and improved data sources become available, BEA plans to resume production of these statistics.
Archived GDP statistics for the USVI will continue to be available on BEA’s website.