
News Release
U.S. International Investment Position, 1st Quarter 2024 and Annual Update
First Quarter
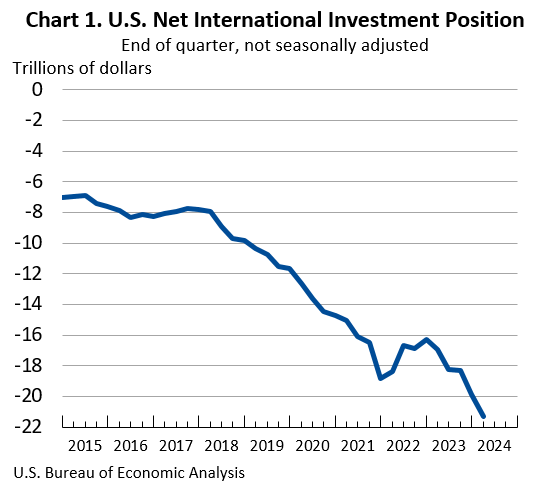
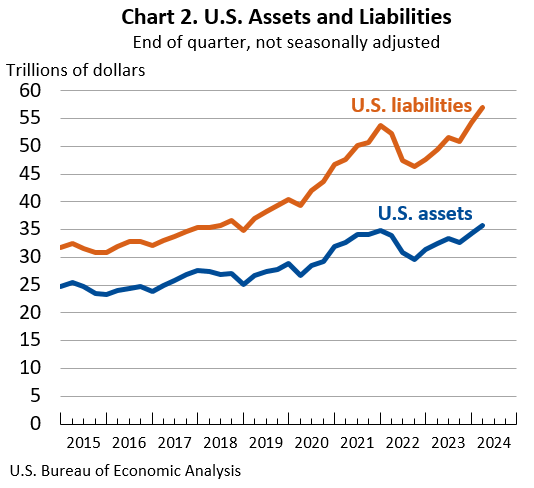
The U.S. net international investment position, the difference between U.S. residents’ foreign financial assets and liabilities, was –$21.28 trillion at the end of the first quarter of 2024, according to statistics released today by the Bureau of Economic Analysis (BEA) (chart 1). Assets totaled $35.78 trillion, and liabilities were $57.06 trillion (chart 2). At the end of the fourth quarter of 2023, the net investment position was –$19.85 trillion (revised). The net investment position and components of assets and liabilities are presented in table 1.
The –$1.43 trillion change in the net investment position from the fourth quarter of 2023 to the first quarter of 2024 came from net financial transactions of –$179.1 billion and net other changes in position, such as price and exchange-rate changes, of –$1.25 trillion (table 2).
Exchange-rate changes of –$592.1 billion reflected the depreciation of major foreign currencies against the U.S. dollar, which lowered the value of U.S. assets more than U.S. liabilities in dollar terms.
Price changes of –$565.5 billion reflected U.S. stock price increases that exceeded foreign stock price increases, which raised the market value of U.S. liabilities more than U.S. assets.
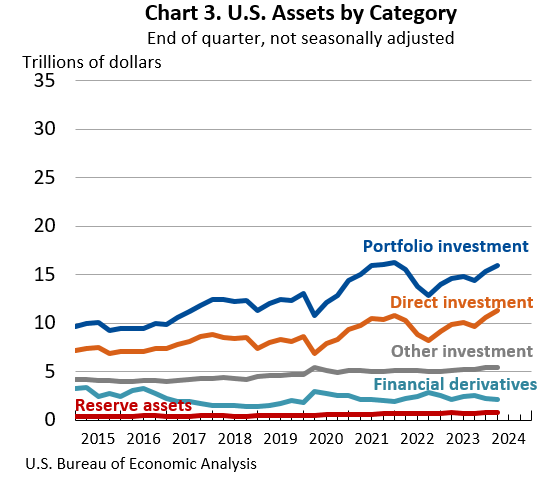
U.S. assets increased by $1.38 trillion to a total of $35.78 trillion at the end of the first quarter, driven mainly by foreign stock price increases that raised the market value of direct investment and portfolio investment assets (chart 3). The impact of stock price increases was partly offset by the depreciation of major foreign currencies against the U.S. dollar that lowered the value of foreign-currency-denominated assets in dollar terms.
Direct investment assets increased by $713.0 billion to $11.32 trillion and portfolio investment assets increased by $664.6 billion to $16.00 trillion, driven mainly by foreign stock price increases that raised the market value of these assets by $779.9 billion and $875.3 billion, respectively (table 2).
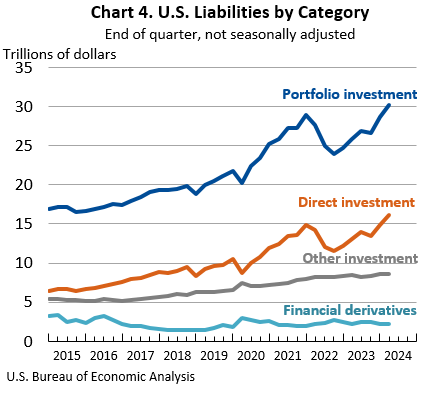
U.S. liabilities increased by $2.81 trillion to a total of $57.06 trillion at the end of the first quarter, driven by U.S. stock price increases that raised the market value of portfolio investment and direct investment liabilities (chart 4).
Portfolio investment liabilities increased by $1.58 trillion to $30.19 trillion and direct investment liabilities increased by $1.27 trillion to $16.08 trillion, driven mainly by U.S. stock price increases that raised the market value of these liabilities by $1.14 trillion and $1.20 trillion, respectively (table 2).
Annual Update of the U.S. International Investment Position Accounts
The statistics in this release reflect the annual update of the U.S. International Investment Position Accounts. With this update, BEA has incorporated newly available and revised source data for 2021–2023 (table 3).
In addition, BEA has incorporated a new methodology for estimating positions in other equity assets (a component of other investment assets), beginning with 2021. Revised positions reflect an initial yearend 2020 position brought forward by accumulating transactions (unrevised) and new estimates of exchange-rate changes for the foreign-currency-denominated equity positions of the U.S. government in the European Bank for Reconstruction and Development, the African Development Bank, and the African Development Fund.
Newly Available and Revised Source Data: Key Providers and Years Affected
More information on the annual update is available in “Preview of the 2024 Annual Update of the International Economic Accounts” in the Survey of Current Business, and additional information will be published in July in the Survey.
Next release: September 25, 2024, at 8:30 a.m. EDT
U.S. International Investment Position, 2nd Quarter 2024