
News Release
Gross Domestic Product, 4th Quarter and Year 2024 (Second Estimate)
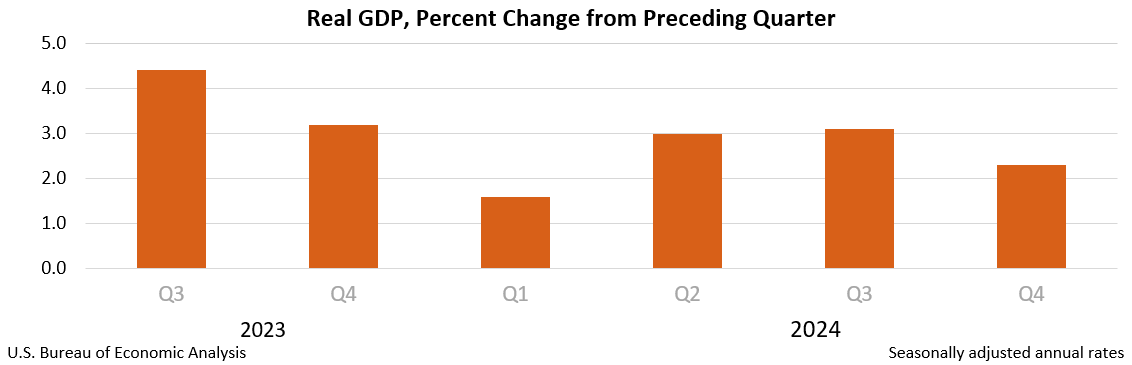
Real gross domestic product (GDP) increased at an annual rate of 2.3 percent in the fourth quarter of 2024 (October, November, and December), according to the second estimate released by the U.S. Bureau of Economic Analysis. In the third quarter, real GDP increased 3.1 percent.
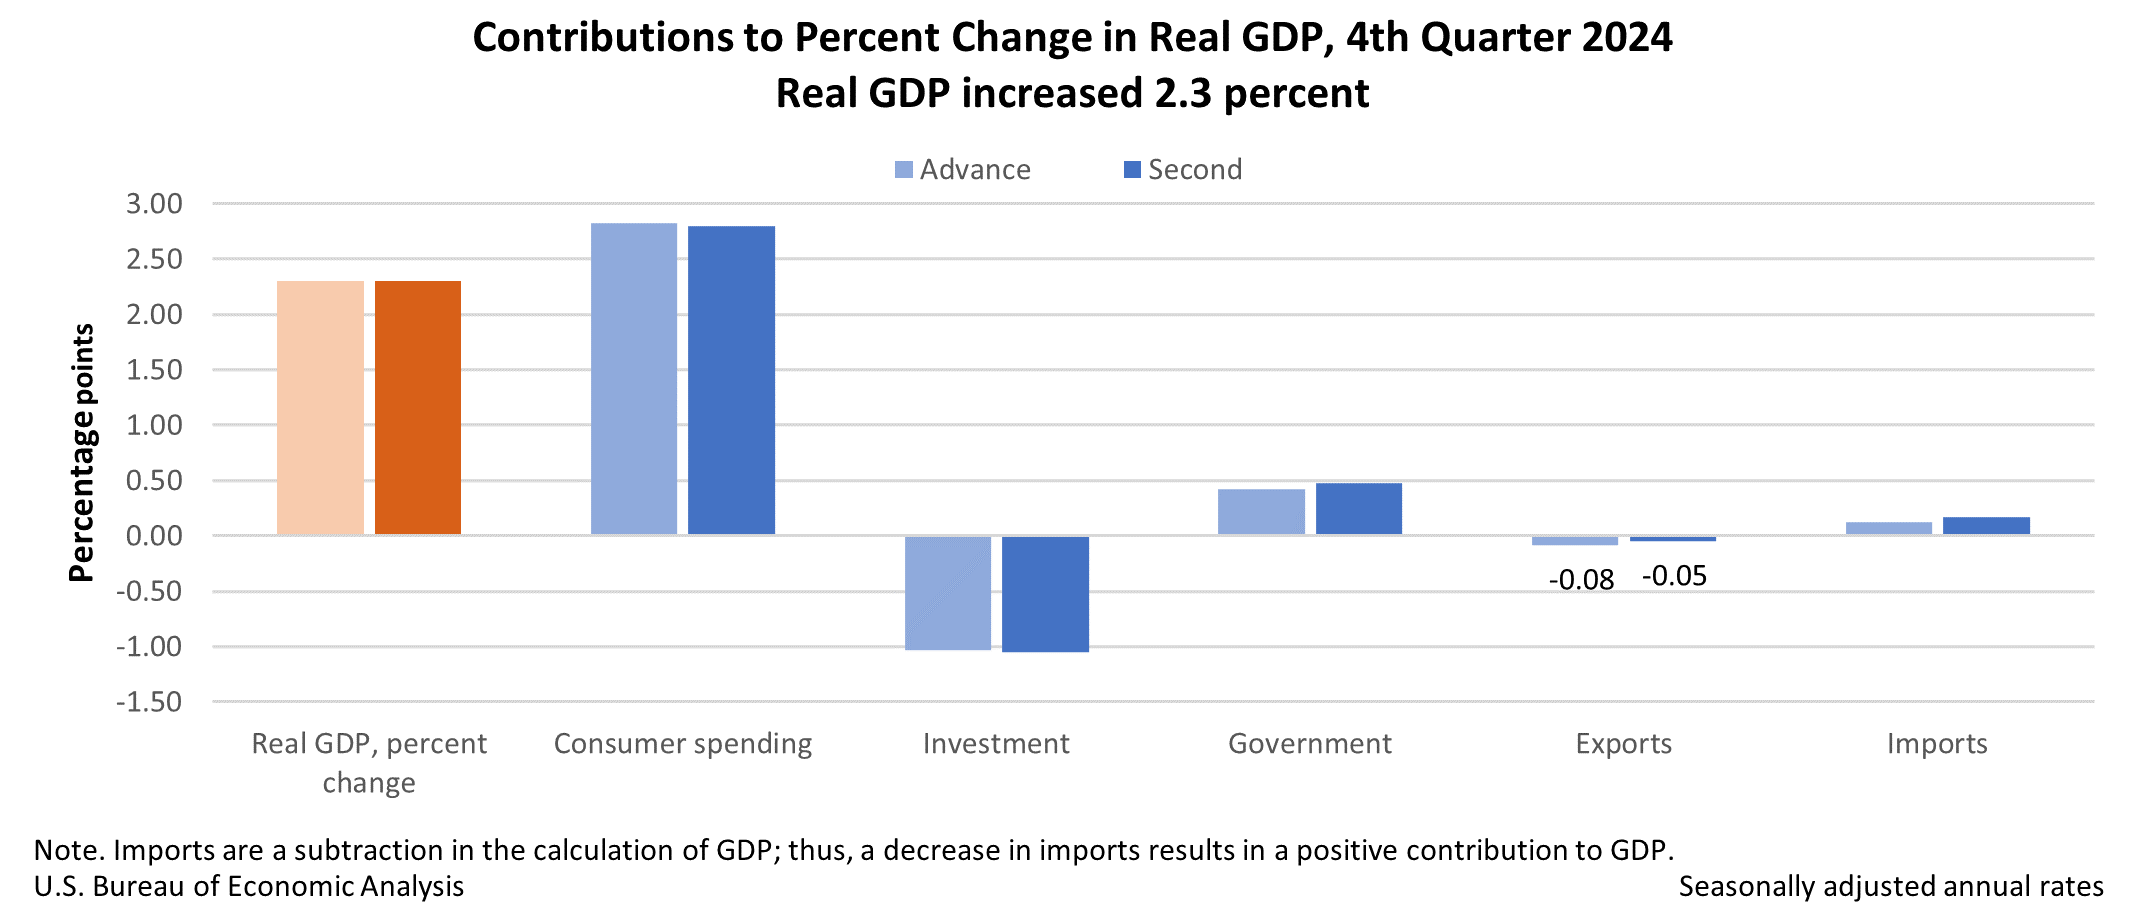
The increase in real GDP in the fourth quarter primarily reflected increases in consumer spending and government spending that were partly offset by a decrease in investment. Imports, which are a subtraction in the calculation of GDP, decreased. For more information, refer to the “Technical Notes” below.
Real GDP was revised up by less than 0.1 percentage point from the advance estimate released last month, primarily reflecting upward revisions to government spending and exports that were partly offset by downward revisions to consumer spending and investment.
Compared to the third quarter, the deceleration in real GDP in the fourth quarter primarily reflected downturns in investment and exports that were partly offset by an acceleration in consumer spending. Imports turned down.
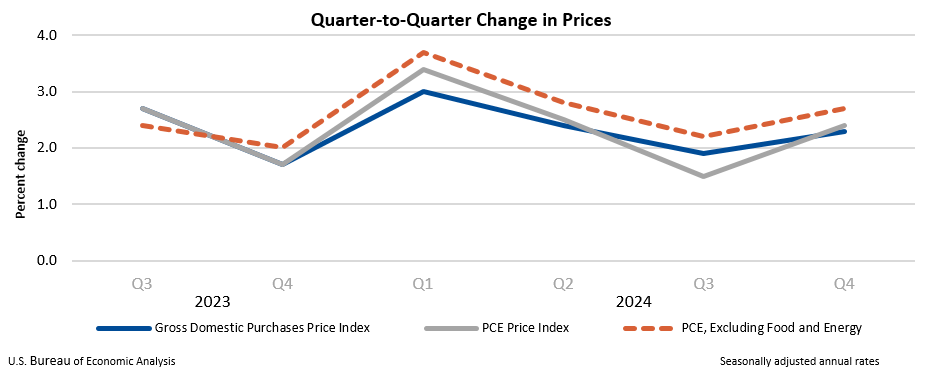
The price index for gross domestic purchases increased 2.3 percent in the fourth quarter, revised up 0.1 percentage point from the previous estimate. The personal consumption expenditures (PCE) price index increased 2.4 percent, revised up 0.1 percentage point. Excluding food and energy prices, the PCE price index increased 2.7 percent, revised up 0.2 percentage point.
| Real GDP and Related Measures | ||
|---|---|---|
| (Percent change from Q3 to Q4) | ||
| Advance Estimate | Second Estimate | |
| Real GDP | 2.3 | 2.3 |
| Current-dollar GDP | 4.5 | 4.8 |
| Gross domestic purchases price index | 2.2 | 2.3 |
| PCE price index | 2.3 | 2.4 |
| PCE price index excluding food and energy | 2.5 | 2.7 |
GDP for 2024
Real GDP increased 2.8 percent in 2024 (from the 2023 annual level to the 2024 annual level), the same as previously estimated. The increase in real GDP in 2024 reflected increases in consumer spending, investment, government spending, and exports. Imports increased.
The price index for gross domestic purchases increased 2.4 percent in 2024, revised up 0.1 percentage point. The PCE price index increased 2.5 percent, the same as the previous estimate. Excluding food and energy prices, the PCE price index increased 2.8 percent, also the same as the previous estimate.
Next release: March 27, 2025, at 8:30 a.m. EDT
Gross Domestic Product (Third Estimate)
Corporate Profits
Gross Domestic Product by Industry
4th Quarter and Year 2024
Technical Notes
Sources of revisions to real GDP in the second estimate
Real GDP increased at an annual rate of 2.3 percent (0.6 percent at a quarterly rate1), an upward revision of less than 0.1 percentage point from the previous estimate, primarily reflecting upward revisions to government spending and exports that were partly offset by downward revisions to consumer spending and investment. Imports, which are a subtraction in the calculation of GDP, were revised down.
- The revision to government spending primarily reflected an upward revision to federal government spending (notably, defense consumption expenditures), based on Bureau of Labor Statistics (BLS) employment data.
- For both exports and imports, the revised estimates primarily reflected updated data from BEA’s International Transactions Accounts as well as new and revised Census Bureau trade in goods data for December. The revision to imports was led by a downward revision to other goods, reflecting a downward revision to the territorial adjustment.2
- The downward revision to consumer spending reflected a downward revision to goods that was partly offset by an upward revision to services.
- Within goods, the downward revision was led by other durable goods (notably, jewelry and watches), based on revised Census Bureau Monthly Retail Trade Survey (MRTS) data.
- Within services, the upward revision was led by recreation services (led by video and audio streaming and rental), based primarily on financial reports for publicly traded companies, and food services, based on revised Census MRTS data.
- The downward revision to investment reflected a downward revision to nonresidential fixed investment that was partly offset by an upward revision to private inventory investment.
- Within nonresidential fixed investment, the leading contributor to the downward revision was intellectual property products (led by research and development), based on R&D expenses reported by publicly traded companies.
- Within private inventory investment, the revision primarily reflected an upward revision to nonfarm inventories (led by merchant wholesale), based primarily on revised Census Bureau book value data.
More information on the source data and BEA assumptions that underlie the fourth-quarter estimate is shown in the key source data and assumptions table.
1. Percent changes in quarterly seasonally adjusted series are displayed at annual rates, unless otherwise specified. For more information, refer to the FAQ Why does BEA publish percent changes in quarterly series at annual rates?.
2. Consists of transactions between the United States and its territories, Puerto Rico, and the Northern Mariana Islands. The treatment of U.S. territories, Puerto Rico, and the Northern Mariana Islands in the National Income and Product Accounts (NIPAs) differs from that in the International Transactions Accounts (ITAs). In the NIPAs, U.S. territories are included in the rest of the world; in the ITAs, they are treated as part of the United States.