
News Release
U.S. International Investment Position, 4th Quarter and Year 2024
Fourth Quarter
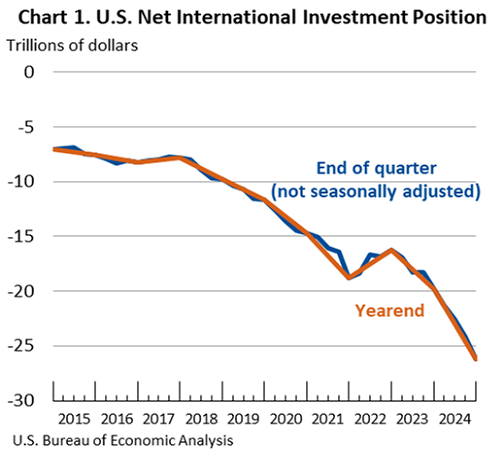
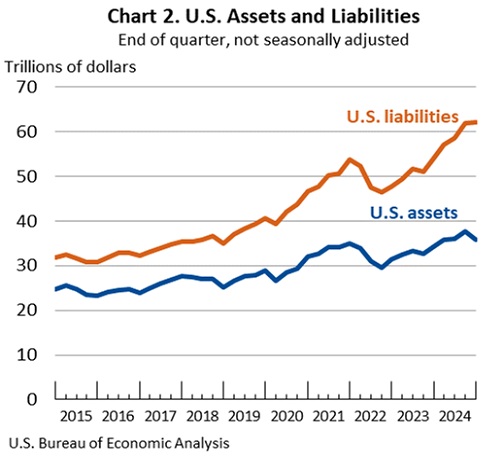
The U.S. net international investment position, the difference between U.S. residents’ foreign financial assets and liabilities, was –$26.23 trillion at the end of the fourth quarter of 2024, according to statistics released today by the U.S. Bureau of Economic Analysis (chart 1). Assets totaled $35.89 trillion, and liabilities were $62.12 trillion (chart 2). At the end of the third quarter, the net investment position was –$24.15 trillion (revised). The net investment position and components of assets and liabilities are presented in table 1.
The –$2.08 trillion change in the net investment position from the third quarter to the fourth quarter came from net financial transactions of –$411.2 billion and net other changes in position, such as price and exchange-rate changes, of –$1.67 trillion (table 2).
Exchange-rate changes of –$1.18 trillion reflected major foreign currency depreciation against the U.S. dollar, which lowered the value of U.S. assets more than U.S. liabilities in dollar terms.
Price changes of –$632.0 billion reflected price decreases for assets and price increases for liabilities, as foreign stock prices underperformed relative to U.S. stock prices. Both foreign and U.S. bond prices decreased in the fourth quarter.
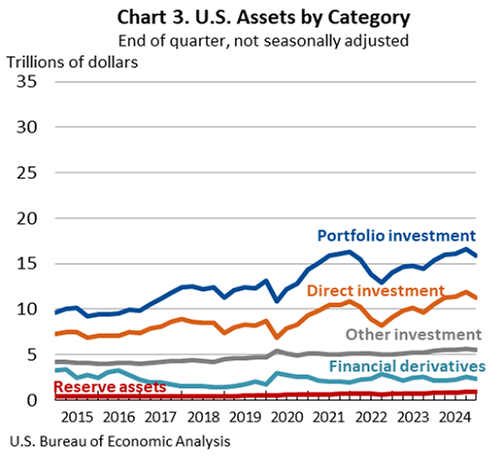
U.S. assets decreased by $1.77 trillion to a total of $35.89 trillion at the end of the fourth quarter, driven by the depreciation of foreign currencies against the U.S. dollar that lowered the value of U.S. assets in dollar terms. All major investment categories of assets decreased, notably portfolio investment and direct investment assets (chart 3).
Portfolio investment assets decreased by $734.6 billion to $15.87 trillion and direct investment assets decreased by $643.1 billion to $11.27 trillion, reflecting exchange-rate changes of –$701.7 billion and –$518.5 billion, respectively (table 2).

U.S. liabilities increased by $306.2 billion to a total of $62.12 trillion at the end of the fourth quarter, driven by financial transactions of $402.8 billion, notably foreign purchases of U.S. stocks and long-term debt securities. Increases in portfolio investment and direct investment liabilities were partly offset by decreases in financial derivatives and other investment liabilities (chart 4).
Portfolio investment liabilities increased by $357.6 billion to $33.09 trillion, driven by financial transactions of $328.0 billion. Direct investment liabilities increased by $295.6 billion to $17.84 trillion, driven by price changes of $236.1 billion (table 2).
Table A. Updates to Third-Quarter 2024 International Investment Position Aggregates
[Trillions of dollars, not seasonally adjusted]
| Preliminary estimates | Revised estimates | |
| U.S. net international investment position | –23.60 | –24.15 |
| U.S. assets | 37.86 | 37.66 |
| U.S. liabilities | 61.46 | 61.81 |
|
U.S. Bureau of Economic Analysis |
||
Year 2024
The U.S. net international investment position was –$26.23 trillion at the end of 2024, compared to –$19.85 trillion at the end of 2023. The net investment position and components of assets and liabilities are presented in table 3.
The –$6.38 trillion change in the net investment position from the end of 2023 to the end of 2024 came from net financial transactions of –$1.27 trillion and net other changes in position, such as price and exchange-rate changes, of –$5.11 trillion (table 3).
Price changes of –$3.43 trillion reflected U.S. stock price increases that exceeded foreign stock price increases, which raised the market value of U.S. liabilities more than U.S. assets.
Exchange-rate changes of –$1.06 trillion reflected the depreciation of major foreign currencies against the U.S. dollar, which lowered the value of U.S. assets more than U.S. liabilities in dollar terms.
U.S. assets increased by $1.49 trillion to a total of $35.89 trillion at the end of 2024, driven by foreign stock price increases and by financial transactions that were partly offset by exchange-rate changes. All major investment categories of assets increased, notably direct investment and portfolio investment assets (chart 5).
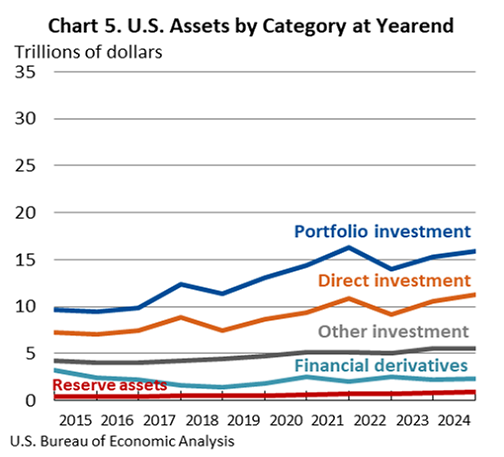
Direct investment assets increased by $658.6 billion to $11.27 trillion and portfolio investment assets increased by $539.0 billion to $15.87 trillion, reflecting increases in foreign stock prices and financial transactions that were largely offset by exchange-rate changes (table 3).
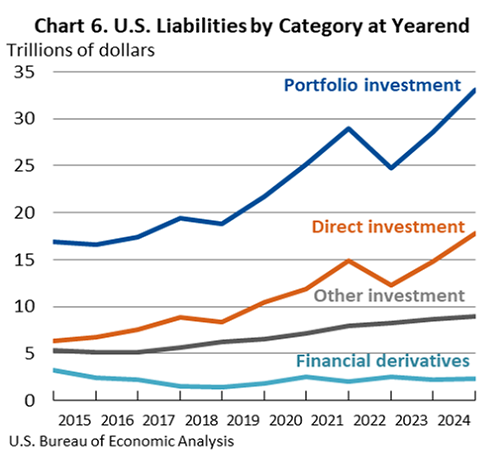
U.S. liabilities increased by $7.86 trillion to a total of $62.12 trillion at the end of 2024, driven by U.S. stock price increases and by financial transactions that mostly reflected foreign purchases of U.S. long-term debt securities and stocks. All major investment categories of liabilities increased, notably portfolio investment and direct investment liabilities (chart 6).
Portfolio investment liabilities increased by $4.47 trillion to $33.09 trillion and direct investment liabilities increased by $3.03 trillion to $17.84 trillion, driven by U.S. stock price increases that raised the market value of these liabilities and by financial transactions (table 3).
Upcoming Update to the U.S. International Investment Position
The annual update of the U.S. international investment position will be released along with preliminary estimates for the first quarter of 2025 on June 30, 2025. A preview of the annual update will be available in the Survey of Current Business in April 2025.
Next release: June 30, 2025, at 8:30 a.m. EDT
U.S. International Investment Position, 1st Quarter 2025 and Annual Update