
News Release
U.S. International Trade in Goods and Services, December and Annual 2024
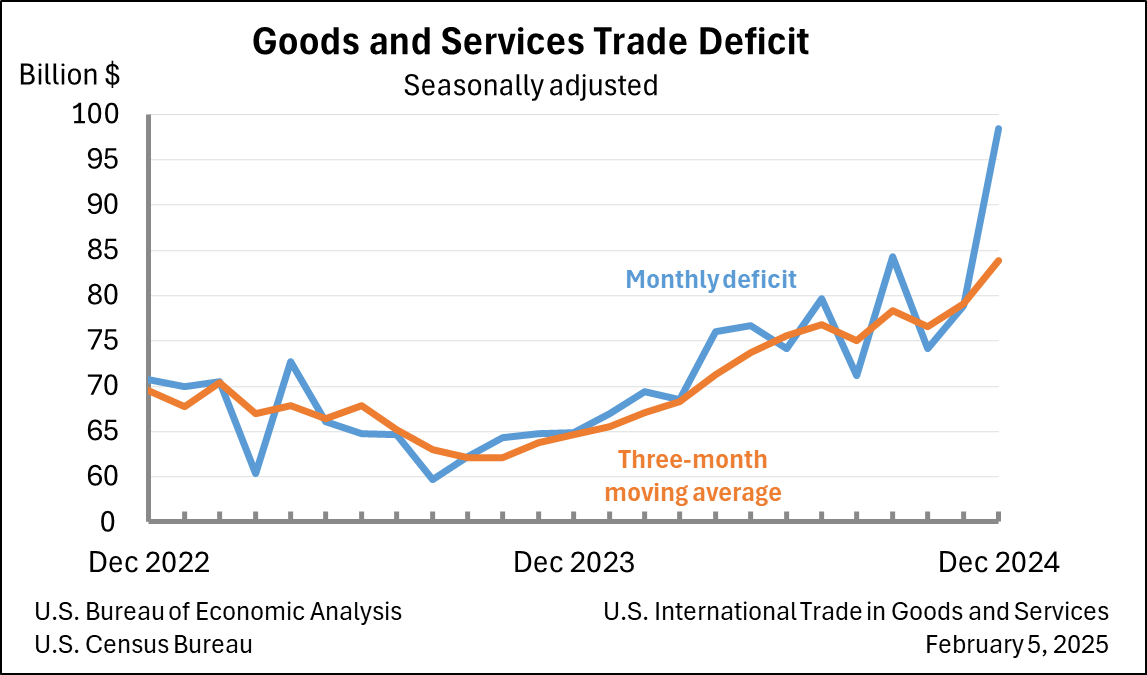
The U.S. Census Bureau and the U.S. Bureau of Economic Analysis announced today that the goods and services deficit was $98.4 billion in December, up $19.5 billion from $78.9 billion in November, revised.
| Deficit: | $98.4 Billion | +24.7%° |
| Exports: | $266.5 Billion | –2.6%° |
| Imports: | $364.9 Billion | +3.5%° |
|
Next release: Thursday, March 6, 2025 (°) Statistical significance is not applicable or not measurable. Data adjusted for seasonality but not price changes Source: U.S. Census Bureau, U.S. Bureau of Economic Analysis; U.S. International Trade in Goods and Services, February 5, 2025 |
||
Exports, Imports, and Balance (exhibit 1)
December exports were $266.5 billion, $7.1 billion less than November exports. December imports were $364.9 billion, $12.4 billion more than November imports.
The December increase in the goods and services deficit reflected an increase in the goods deficit of $18.9 billion to $123.0 billion and a decrease in the services surplus of $0.6 billion to $24.5 billion.
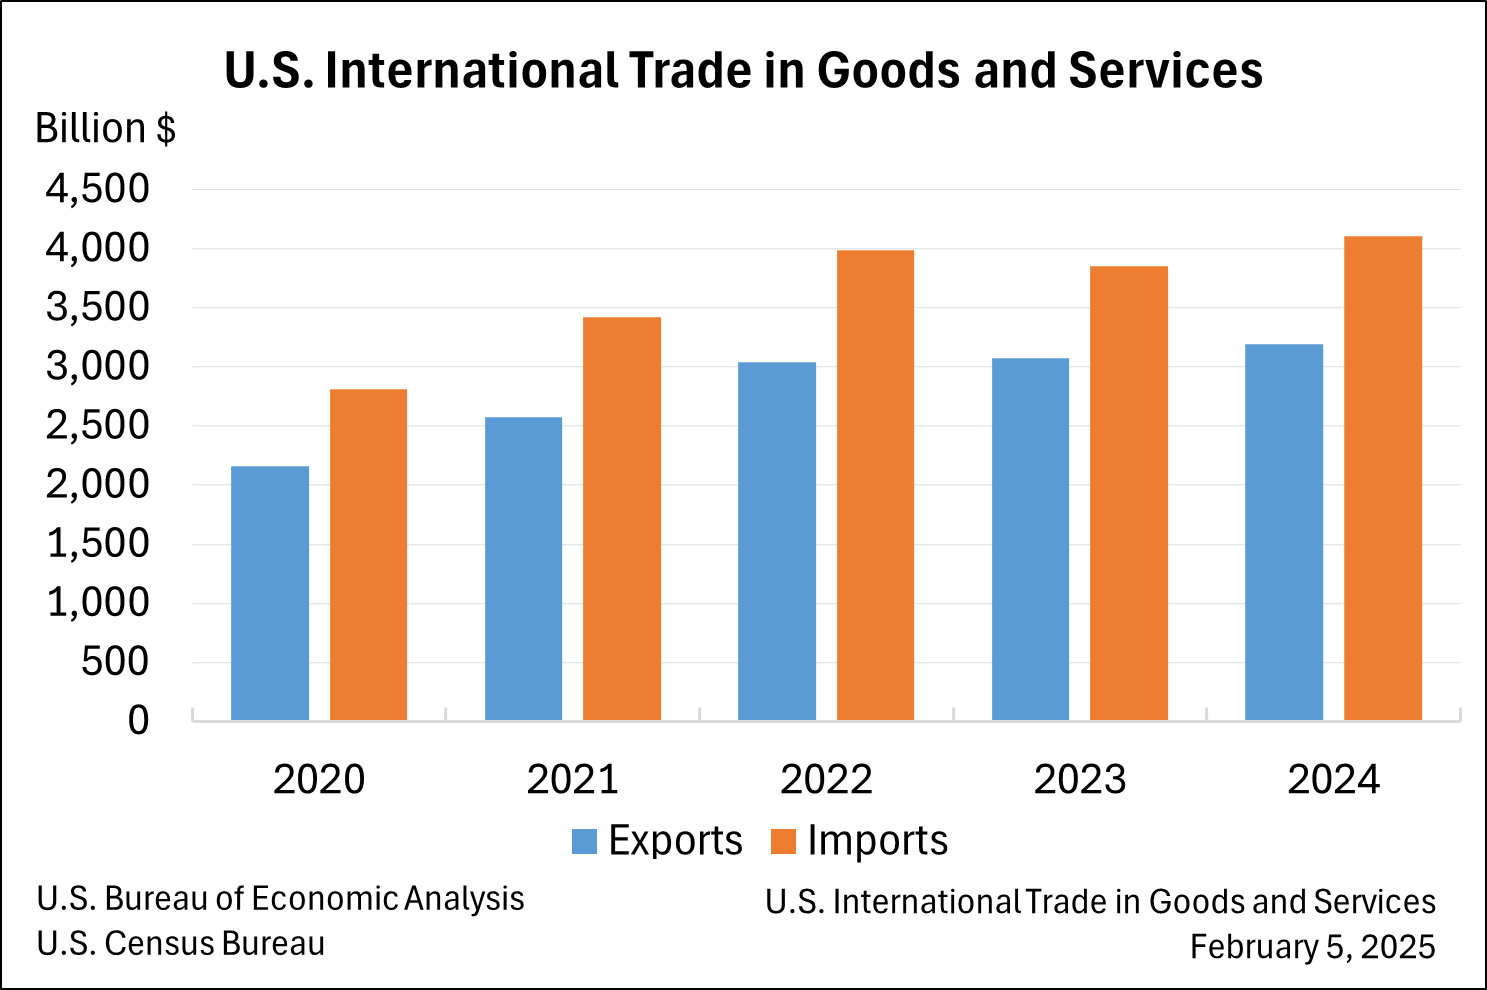
For 2024, the goods and services deficit increased $133.5 billion, or 17.0 percent, from 2023. Exports increased $119.8 billion or 3.9 percent. Imports increased $253.3 billion or 6.6 percent.
Three-Month Moving Averages (exhibit 2)
The average goods and services deficit increased $4.7 billion to $83.8 billion for the three months ending in December.
- Average exports decreased $1.2 billion to $268.8 billion in December.
- Average imports increased $3.5 billion to $352.7 billion in December.
Year-over-year, the average goods and services deficit increased $19.2 billion from the three months ending in December 2023.
- Average exports increased $9.8 billion from December 2023.
- Average imports increased $29.0 billion from December 2023.
Exports (exhibits 3, 6, and 7)
Exports of goods decreased $7.5 billion to $170.2 billion in December.
Exports of goods on a Census basis decreased $6.7 billion.
- Consumer goods decreased $1.8 billion.
- Pharmaceutical preparations decreased $1.4 billion.
- Industrial supplies and materials decreased $1.8 billion.
- Crude oil decreased $0.9 billion.
- Other petroleum products decreased $0.3 billion.
- Other precious metals decreased $0.3 billion.
- Fertilizers, pesticides, and insecticides decreased $0.3 billion.
- Capital goods decreased $1.4 billion.
- Computers decreased $0.9 billion.
- Civilian aircraft increased $1.4 billion.
- Automotive vehicles, parts, and engines decreased $0.9 billion.
- Trucks, buses, and special purpose vehicles decreased $0.4 billion.
- Other automotive parts and accessories decreased $0.3 billion.
Net balance of payments adjustments decreased $0.8 billion.
Exports of services increased $0.4 billion to $96.3 billion in December.
- Travel increased $0.3 billion.
- Financial services increased $0.1 billion.
Imports (exhibits 4, 6, and 8)
Imports of goods increased $11.4 billion to $293.1 billion in December.
Imports of goods on a Census basis increased $11.3 billion.
- Industrial supplies and materials increased $10.8 billion.
- Finished metal shapes increased $9.2 billion.
- Nonmonetary gold increased $1.0 billion.
- Consumer goods increased $2.2 billion.
- Toys, games, and sporting goods increased $0.8 billion.
- Cell phones and other household goods increased $0.8 billion.
- Capital goods increased $1.3 billion.
- Computers increased $1.2 billion.
- Computer accessories increased $0.9 billion.
- Civilian aircraft decreased $1.1 billion.
- Automotive vehicles, parts, and engines decreased $2.2 billion.
- Passenger cars decreased $1.6 billion.
Net balance of payments adjustments increased $0.1 billion.
Imports of services increased $1.0 billion to $71.8 billion in December.
- Transport increased $0.5 billion.
- Travel increased $0.3 billion.
Real Goods in 2017 Dollars – Census Basis (exhibit 11)
The real goods deficit increased $14.9 billion, or 15.4 percent, to $111.9 billion in December, compared to a 17.3 percent increase in the nominal deficit.
- Real exports of goods decreased $5.4 billion, or 3.7 percent, to $141.9 billion, compared to a 3.8 percent decrease in nominal exports.
- Real imports of goods increased $9.5 billion, or 3.9 percent, to $253.8 billion, compared to a 4.0 percent increase in nominal imports.
Revisions
In addition to revisions to source data for the November statistics, the seasonally adjusted goods data were revised for January through November so that the totals of the seasonally adjusted months equal the annual totals.
Revisions to November exports
- Exports of goods were revised up $0.1 billion.
- Exports of services were revised up $0.1 billion.
Revisions to November imports
- Imports of goods were revised up $0.8 billion.
- Imports of services were revised up $0.1 billion.
Goods by Selected Countries and Areas: Monthly – Census Basis (exhibit 19)
The December figures show surpluses, in billions of dollars, with Netherlands ($5.0), South and Central America ($3.5), United Kingdom ($2.3), Hong Kong ($0.7), Brazil ($0.4), Saudi Arabia ($0.4), Belgium ($0.3), and Australia ($0.2). Deficits were recorded, in billions of dollars, with China ($25.3), European Union ($20.4), Mexico ($15.2), Switzerland ($13.0), Vietnam ($11.4), Canada ($7.9), Germany ($7.6), Taiwan ($6.9), Ireland ($6.2), South Korea ($5.6), Japan ($5.5), India ($4.9), Italy ($4.1), Malaysia ($2.5), France ($1.1), Israel ($0.8), and Singapore ($0.4).
- The deficit with Switzerland increased $9.1 billion to $13.0 billion in December. Exports decreased $0.7 billion to $1.2 billion and imports increased $8.4 billion to $14.2 billion.
- The deficit with Canada increased $2.9 billion to $7.9 billion in December. Exports decreased $0.4 billion to $29.1 billion and imports increased $2.5 billion to $37.0 billion.
- The deficit with Ireland decreased $3.1 billion to $6.2 billion in December. Exports decreased $0.1 billion to $1.2 billion and imports decreased $3.2 billion to $7.5 billion.
Annual Summary for 2024
Exports, Imports, and Balance (exhibit 1)
For 2024, the goods and services deficit was $918.4 billion, up $133.5 billion from $784.9 billion in 2023. Exports were $3,191.6 billion, up $119.8 billion from 2023. Imports were $4,110.0 billion, up $253.3 billion from 2023.
The 2024 increase in the goods and services deficit reflected an increase in the goods deficit of $148.5 billion, or 14.0 percent, to $1,211.7 billion and an increase in the services surplus of $14.9 billion, or 5.4 percent, to $293.3 billion.
The goods and services deficit was 3.1 percent of current-dollar gross domestic product in 2024, up from 2.8 percent in 2023.
Exports (exhibits 3, 6, and 7)
Exports of goods increased $38.6 billion to $2,083.8 billion in 2024.
Exports of goods on a Census basis increased $47.1 billion.
- Capital goods increased $40.2 billion.
- Computer accessories increased $11.3 billion.
- Civilian aircraft engines increased $8.7 billion.
- Computers increased $8.2 billion.
- Semiconductors increased $8.1 billion.
- Other goods increased $17.9 billion. (See the “Notice” for more information.)
- Automotive vehicles, parts, and engines decreased $10.8 billion.
- Other automotive parts and accessories decreased $4.3 billion.
- Passenger cars decreased $4.0 billion.
- Trucks, buses, and special purpose vehicles decreased $3.0 billion.
Net balance of payments adjustments decreased $8.5 billion.
Exports of services increased $81.2 billion to $1,107.8 billion in 2024.
- Travel increased $26.3 billion.
- Other business services increased $16.0 billion.
- Telecommunications, computer, and information services increased $11.9 billion.
- Financial services increased $11.6 billion.
Imports (exhibits 4, 6, and 8)
Imports of goods increased $187.1 billion to $3,295.6 billion in 2024.
Imports of goods on a Census basis increased $187.2 billion.
- Capital goods increased $103.3 billion.
- Computer accessories increased $33.5 billion.
- Computers increased $28.3 billion.
- Semiconductors increased $9.4 billion.
- Other industrial machinery increased $9.0 billion.
- Consumer goods increased $48.4 billion.
- Pharmaceutical preparations increased $43.6 billion.
- Automotive vehicles, parts, and engines increased $16.1 billion.
- Passenger cars increased $10.0 billion.
- Other automotive parts and accessories increased $4.8 billion.
- Foods, feeds, and beverages increased $15.9 billion.
- Meat products increased $3.5 billion.
- Fruits, frozen juices increased $2.3 billion.
- Bakery products increased $2.2 billion.
- Other foods increased $2.0 billion.
- Vegetables increased $1.7 billion.
Net balance of payments adjustments decreased $0.2 billion.
Imports of services increased $66.2 billion to $814.4 billion in 2024.
- Travel increased $19.2 billion.
- Charges for the use of intellectual property increased $12.2 billion.
- Transport increased $11.7 billion.
- Insurance services increased $11.5 billion.
Real Goods in 2017 Dollars – Census Basis (exhibit 11)
The real goods deficit increased $98.8 billion, or 9.6 percent, to $1,132.4 billion in 2024, compared to a 13.2 percent increase in the nominal deficit.
- Real exports of goods increased $41.7 billion, or 2.5 percent, to $1,737.8 billion, compared to a 2.3 percent increase in nominal exports.
- Real imports of goods increased $140.5 billion, or 5.1 percent, to $2,870.2 billion, compared to a 6.1 percent increase in nominal imports.
Goods by Selected Countries and Areas – Census Basis (exhibits 14 and 14a)
The 2024 figures show surpluses, in billions of dollars, with Netherlands ($55.5), South and Central America ($47.3), Hong Kong ($21.9), Australia ($17.9), and United Kingdom ($11.9). Deficits were recorded, in billions of dollars, with China ($295.4), European Union ($235.6), Mexico ($171.8), Vietnam ($123.5), Ireland ($86.7), Germany ($84.8), Taiwan ($73.9), Japan ($68.5), South Korea ($66.0), Canada ($63.3), India ($45.7), Thailand ($45.6), Italy ($44.0), Switzerland ($38.5), Malaysia ($24.8), Indonesia ($17.9), France ($16.4), Austria ($13.1), and Sweden ($9.8).
- The deficit with the European Union increased $26.9 billion to $235.6 billion in 2024. Exports increased $2.6 billion to $370.2 billion and imports increased $29.4 billion to $605.8 billion.
- The deficit with Taiwan increased $26.1 billion to $73.9 billion in 2024. Exports increased $2.4 billion to $42.3 billion and imports increased $28.5 billion to $116.3 billion.
- The surplus with the Netherlands increased $12.7 billion to $55.5 billion in 2024. Exports increased $8.3 billion to $89.6 billion and imports decreased $4.4 billion to $34.1 billion.
All statistics referenced are seasonally adjusted; statistics are on a balance of payments basis unless otherwise specified. Additional statistics, including not seasonally adjusted statistics and details for goods on a Census basis, are available in exhibits 1-20b of this release. For information on data sources, definitions, and revision procedures, see the explanatory notes in this release. The full release can be found at www.census.gov/foreign-trade/Press-Release/current_press_release/index.html or www.bea.gov/data/intl-trade-investment/international-trade-goods-and-services. The full schedule is available in the Census Bureau’s Economic Briefing Room at www.census.gov/economic-indicators/ or on BEA’s website at www.bea.gov/news/schedule.
Next release: March 6, 2025, at 8:30 a.m EST
U.S. International Trade in Goods and Services, January 2025
Impact of Canada Border Services Agency’s (CBSA) Release of CBSA Assessment and Revenue Management (CARM)
The CBSA introduced a new accounting system (CARM) on October 21, 2024. As a result, importers in Canada have experienced delays in filing shipment information. These delays affected the compilation of statistics on U.S. exports of goods to Canada for September through December 2024, which are derived from data compiled by Canada through the United States - Canada Data Exchange. A dollar estimate of the filing backlog is included in estimates for late receipts and, following the Census Bureau’s customary practice for late receipt estimates, is included in the export end-use category “Other goods” as well as in exports to Canada. This estimate will be replaced with the actual transactions reported by the Harmonized System classification in June 2025 with the release of “U.S. International Trade in Goods and Services, Annual Revision.” Until then, please refer to the supplemental spreadsheet “CARM Exports to Canada Corrections,” which provides a breakdown of the late receipts by 1-digit end-use category. This spreadsheet will be updated as late export transactions are received to reflect reassignments from the initial “Other goods” category to the appropriate 1-digit end-use category.
If you have questions or need additional information, please contact the Census Bureau, Economic Indicators Division, International Trade Macro Analysis Branch, on 800-549-0595, option 4, or at eid.international.trade.data@census.gov or BEA, Balance of Payments Division, at InternationalAccounts@bea.gov.
Upcoming Changes to the Real (Chained-Dollar) Series
Effective with the release of the February 2025 statistics on April 3, 2025, the Census Bureau will continue to use the Bureau of Labor Statistics (BLS) U.S. Import and Export Price Indexes to calculate the chained-dollar series (exhibits 10 and 11). The BLS will be implementing changes to the indexes with the release of the February 2025 U.S. Import and Export Price Indexes on March 18, 2025. The changes to the indexes could impact the chained-dollar values. Please refer to the BLS notice for additional information on the Upcoming Change to Data Source for Import and Export Price Indexes: U.S. Bureau of Labor Statistics.
If you have any questions or need additional information, please contact the Census Bureau, Economic Statistical Methods Division, International Trade Statistical Methods Branch, on 301-763-3080.