
News Release
GDP (Second Estimate), 4th Quarter and Year 2025
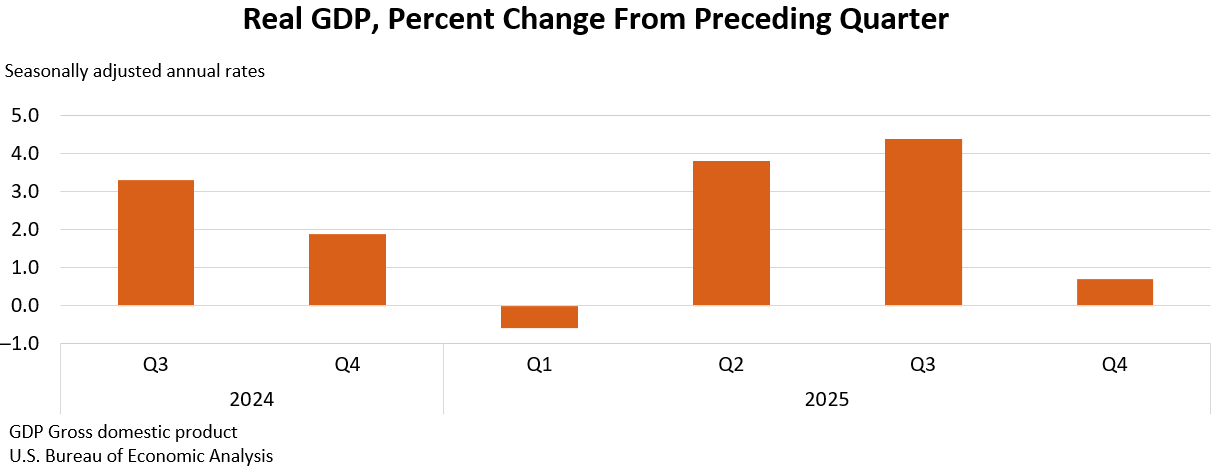
Real gross domestic product (GDP) increased at an annual rate of 0.7 percent in the fourth quarter of 2025 (October, November, and December), according to the second estimate released today by the U.S. Bureau of Economic Analysis. In the third quarter, real GDP increased 4.4 percent.
The second report for the fourth quarter of 2025, originally scheduled for February 26, 2026, was rescheduled due to the October–November 2025 government shutdown.
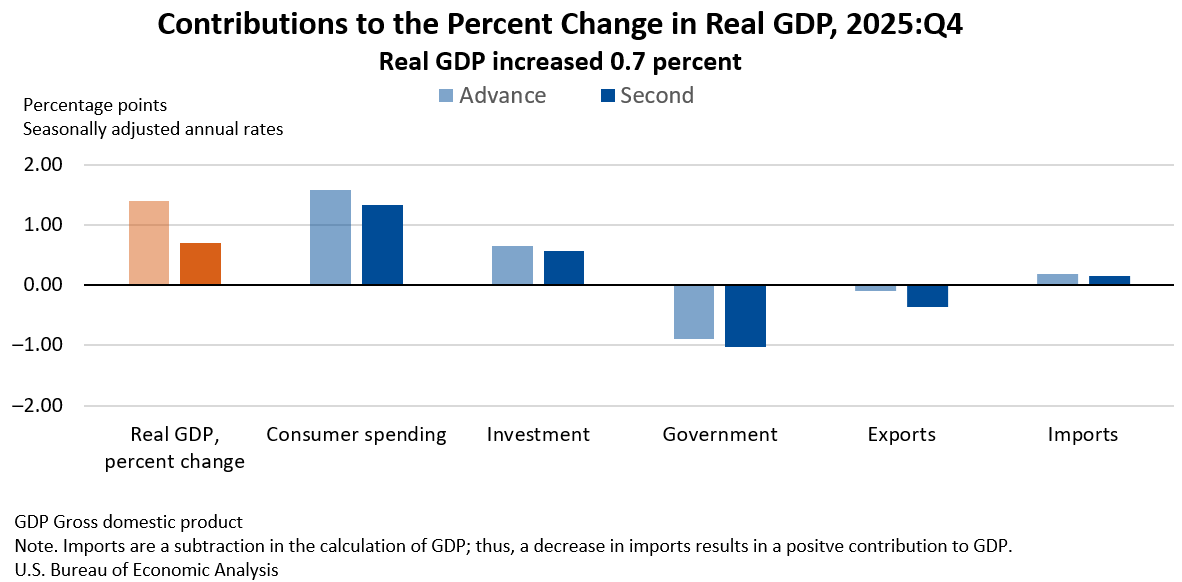
The contributors to the increase in real GDP in the fourth quarter were increases in consumer spending and investment. These movements were partly offset by decreases in government spending and exports. Imports, which are a subtraction in the calculation of GDP, decreased.
Real GDP was revised down 0.7 percentage point from the advance estimate, reflecting downward revisions to exports, consumer spending, government spending, and investment. Imports decreased less than previously estimated. For more information, refer to the "Technical Notes" below.
Compared to the third quarter, the deceleration in real GDP in the fourth quarter reflected downturns in government spending and exports and a deceleration in consumer spending that were partly offset by an acceleration in investment. The decrease in imports was smaller than in the previous quarter.
Real final sales to private domestic purchasers, the sum of consumer spending and gross private fixed investment, increased 1.9 percent in the fourth quarter, revised down 0.5 percentage point from the previous estimate.
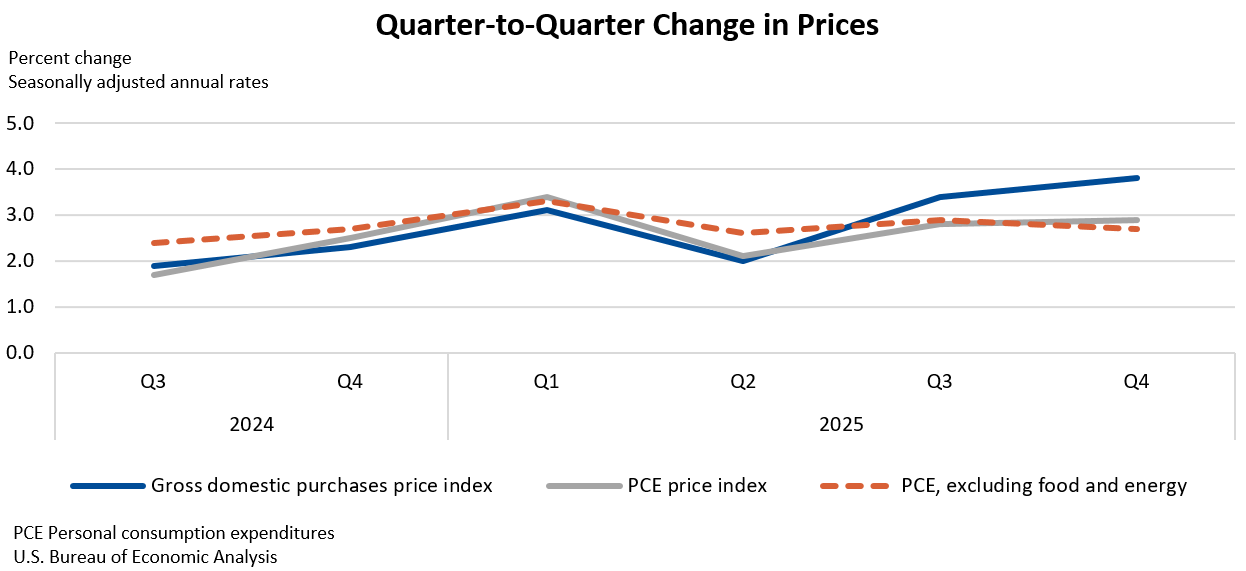
The price index for gross domestic purchases increased 3.8 percent in the fourth quarter, revised up 0.1 percentage point from the previous estimate. The personal consumption expenditures (PCE) price index increased 2.9 percent, the same as previously estimated. Excluding food and energy prices, the PCE price index increased 2.7 percent, also the same as previously estimated. (Refer to “Technical Notes” below for information on how BEA imputed missing U.S. Bureau of Labor Statistics (BLS) October prices.)
| Real GDP and Related Measures [Percent Change (SAAR) from 2025 Q3 to Q4] | ||
|---|---|---|
| Advance estimate | Second Estimate | |
| Real GDP | 1.4 | 0.7 |
| Current-dollar GDP | 5.1 | 4.5 |
| Real final sales to private domestic purchasers | 2.4 | 1.9 |
| Gross domestic purchases price index | 3.7 | 3.8 |
| PCE price index | 2.9 | 2.9 |
| PCE price index excluding food and energy | 2.7 | 2.7 |
GDP for 2025
Real GDP increased 2.1 percent in 2025 (from the 2024 annual level to the 2025 annual level), revised down 0.1 percentage point from the previous estimate. The increase in real GDP in 2025 primarily reflected increases in consumer spending and investment.
The price index for gross domestic purchases increased 2.6 percent in 2025, the same as previously estimated. The PCE price index also increased 2.6 percent, and the PCE price index excluding food and energy increased 2.8 percent, both the same as previously estimated.
For definitions, statistical conventions, information on updates to GDP, links to related tables, and more, visit "Additional Information."
BEA’s ongoing modernization and streamlining of news release packages includes improvements with today's GDP news release. The news release text has been modified to include links to BEA’s online Interactive Data Tables. News release tables in PDF and Excel format will no longer be provided beginning with the third estimate for the fourth quarter of 2025 on April 9, 2026. This change will reduce duplication, increase efficiency, and point users directly to the most complete data.
Next release: April 9, 2026, at 8:30 a.m. EDT
GDP (Third Estimate), GDP by Industry, and Corporate Profits
4th Quarter and Year 2025
Technical Notes
Sources of change for real GDP
Real GDP increased at an annual rate of 0.7 percent (0.2 percent at a quarterly rate 1) in the fourth quarter, a downward revision of 0.7 percentage point from the previous estimate, reflecting downward revisions to exports, consumer spending, government spending, and investment.
- The downward revision to exports reflected a downward revision to services (led by charges for the use of intellectual property), reflecting updated data from BEA’s International Transactions Accounts.
- The downward revision to consumer spending reflected a downward revision to services that was partly offset by an upward revision to goods. Within services, the largest contributor to the downward revision was health care (both hospital and nursing home services as well as outpatient services), based on new fourth-quarter data from the U.S. Census Bureau Quarterly Services Survey (QSS). Within goods, the upward revisions were widespread, based on revised U.S. Census Bureau Monthly Retail Trade Survey data for November and December.
- Within government, the revision primarily reflected a downward revision to state and local government structures investment, based on revised October and new November and December U.S. Census Bureau Value of Construction Put in Place (VPIP) data.
- Within investment, the revision reflected downward revisions to structures and intellectual property products. The revision to structures was led by manufacturing structures, based on revised October and new November and December U.S. Census Bureau VPIP data. The revision to intellectual property products primarily reflected a downward revision to software, based on new U.S Census Bureau QSS data.
More information on the source data and BEA assumptions that underlie the fourth-quarter estimate is shown in the key source data and assumptions table.
October prices
Due to a lapse in federal appropriations, BLS could not collect October 2025 consumer price index (CPI) data. Refer to "2025 federal government shutdown impact on the Consumer Price Index" on the BLS website for more details.
To replace the missing CPIs, BEA derived seasonally adjusted price indexes for October using the geometric mean of the September and November CPIs. BEA derived nonseasonally adjusted price indexes by applying seasonal adjustment factors from October 2024 to the imputed seasonally adjusted values for October 2025.
Note that in "Table 9.1U. Reconciliation of Percent Change in the CPI with Percent Change in the PCE Price Index," the missing CPI values are indicated with dot leaders.
Federal government shutdown
Due to a lapse in appropriations, some federal government agencies were closed, and some employees were furloughed from October 1 through November 12, 2025. The full effects of the partial federal government shutdown on the fourth-quarter estimates cannot be quantified because they are embedded in the regular source data that underlie the estimates and cannot be separately identified. However, BEA did estimate the effects of a reduction in the labor services supplied by federal employees. BEA estimates that this reduction in services provided by the federal government subtracted about 1.0 percentage point from real GDP growth in the fourth quarter. Because furloughed federal employees received back pay, the shutdown had no impact on current-dollar federal compensation and was reflected as a temporary increase in the prices paid for federal employee compensation. For more information, an FAQ, "How are federal government shutdowns reflected in the methodologies used for estimating GDP?," is available on BEA’s website.
Related Data Tables
For the estimates highlighted in this release, as well as historical time series for these estimates, see the following data tables in BEA’s Interactive Data Application.
Table 1.1.1. Percent Change From Preceding Period in Real Gross Domestic Product
Table 1.5.2. Contributions to Percent Change in Real Gross Domestic Product, Expanded Detail
Table 1.4.1. Percent Change From Preceding Period in Real Gross Domestic Product, Real Gross Domestic Purchases, and Real Final Sales to Domestic Purchasers
Table 1.6.7. Percent Change From Preceding Period in Prices for Gross Domestic Purchases
Note. With the next release of GDP, today’s data will be superseded, and the links above will reflect the latest data. The original data featured in this release can then be accessed in BEA’s Data Archive.