
News Release
GDP (Second Estimate) and Corporate Profits, 2nd Quarter 2026
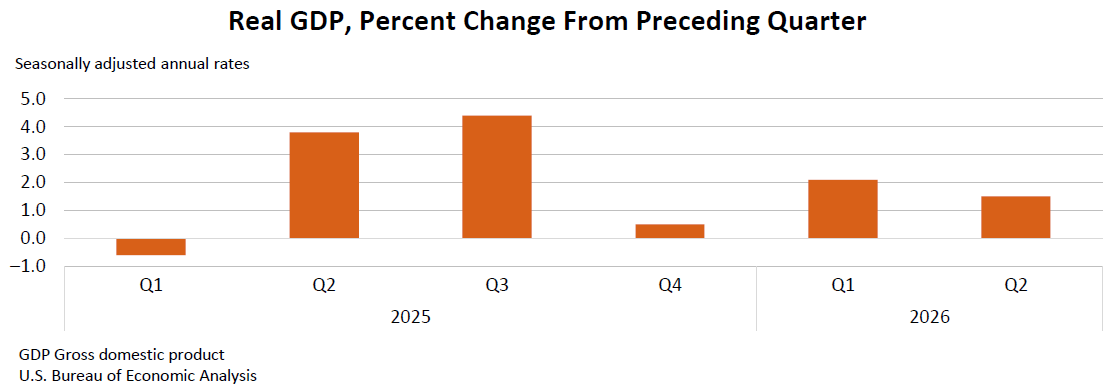
Real gross domestic product (GDP) increased at an annual rate of 1.5 percent in the second quarter of 2026 (April, May, and June), according to the second estimate released today by the U.S. Bureau of Economic Analysis (BEA). In the first quarter, real GDP increased 2.1 percent.
The contributors to the increase in real GDP in the second quarter were increases in consumer spending, exports, and investment that were partly offset by a decrease in government spending. Imports, which are a subtraction in the calculation of GDP, increased.
Real GDP increased at the same rate as in the advance estimate. An upward revision to consumer spending was partly offset by an upward revision to imports. For more information, refer to the "Technical Notes" below.
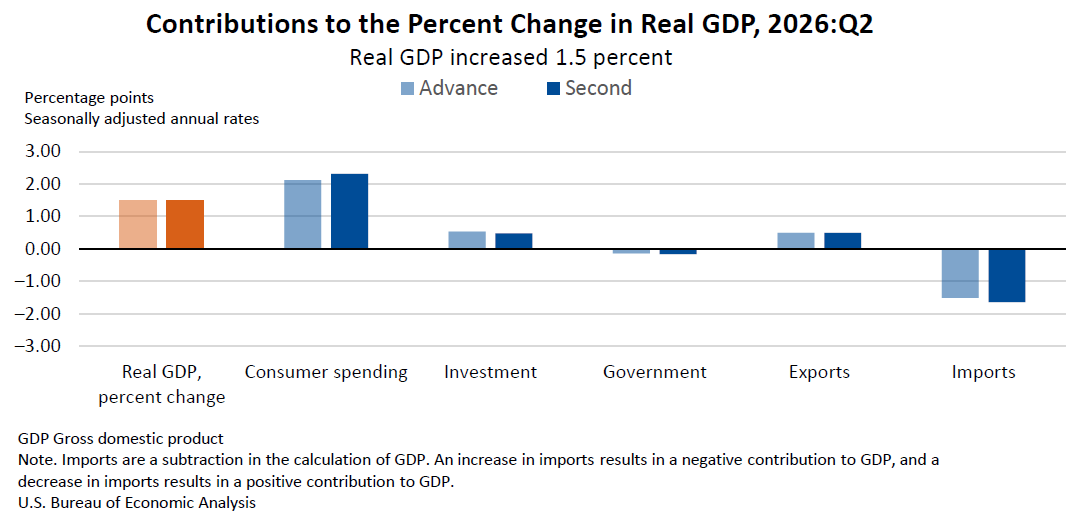
Compared to the first quarter, the deceleration in real GDP in the second quarter reflected a downturn in government spending and decelerations in investment and exports that were partly offset by an acceleration in consumer spending. Imports increased more in the second quarter than in the first quarter.
Real final sales to private domestic purchasers, the sum of consumer spending and gross private fixed investment, increased 4.2 percent in the second quarter, revised up 0.3 percentage point from the previous estimate.
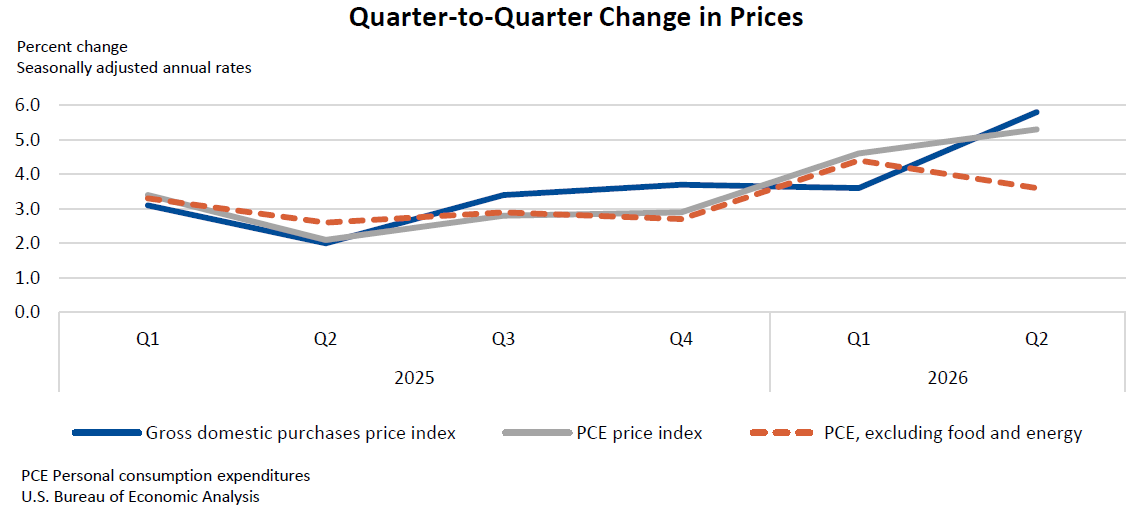
The price index for gross domestic purchases increased 5.8 percent in the second quarter, revised up 0.1 percentage point from the previous estimate. The personal consumption expenditures (PCE) price index increased 5.3 percent, revised up 0.2 percentage point, and the PCE price index excluding food and energy increased 3.6 percent, also revised up 0.2 percentage point.
Real gross domestic income (GDI) increased 2.2 percent in the second quarter, compared with an increase of 1.2 percent in the first quarter. The average of real GDP and real GDI increased 1.8 percent, compared with an increase of 1.7 percent.
Profits from current production (corporate profits with inventory valuation and capital consumption adjustments) increased $400.9 billion in the second quarter, compared with an increase of $74.4 billion in the first quarter.
| Real GDP and Related Measures [Percent Change (SAAR) from 2026:Q1 to 2026:Q2] | ||
|---|---|---|
| Advance Estimate | Second Estimate | |
| Real GDP | 1.5 | 1.5 |
| Current-dollar GDP | 7.9 | 8.0 |
| Real final sales to private domestic purchasers | 3.9 | 4.2 |
| Real GDI | … | 2.2 |
| Average of real GDP and real GDI | … | 1.8 |
| Gross domestic purchases price index | 5.7 | 5.8 |
| PCE price index | 5.1 | 5.3 |
| PCE price index excluding food and energy | 3.4 | 3.6 |
With improvements in the concurrent production of BEA statistics, the 2026 annual updates of national, industry, and regional data will begin on the same day for the first time: September 30, 2026. The annual update of the National Economic Accounts includes GDP, gross domestic income, GDP by industry, monthly personal income and outlays, and related statistics in the National Income and Product Accounts and the Industry Economic Accounts. The update of the Regional Economic Accounts includes GDP by state and by county, personal income by state and by county, and related statistics. For details, refer to "Information on 2026 Annual Updates to the National, Industry, State, and County Statistics."
Next release: September 30, 2026, at 8:30 a.m. EDT
GDP (Third Estimate), Industries, Corporate Profits, State GDP, and State Personal Income,
2nd Quarter 2026; State PCE, 2025
Technical Notes
Sources of revision to real GDP in the second estimate
Real GDP increased at an annual rate of 1.5 percent (0.4 percent at a quarterly rate 1) in the second quarter, a downward revision of less than 0.1 percentage point. An upward revision to consumer spending was partly offset by an upward revision to imports.
- The upward revision to consumer spending reflected an upward revision to services that was partly offset by a downward revision to goods.
- Within services, the upward revision was led by health care (mainly hospitals and physician services), based on newly available U.S. Census Bureau Quarterly Services Survey data.
- Within goods, the downward revision was led by recreational goods and vehicles (mainly information processing equipment), based on revised U.S. Census Bureau Monthly Retail Trade Survey data for May and June, as well as gasoline and other energy goods, based on newly available Energy Information Administration data for May.
- For imports, the revision was led by other goods (notably the territorial adjustment for Puerto Rico), primarily reflecting new U.S. Census Bureau trade in goods data for June.2
Related Data Tables
For the estimates highlighted in this release, as well as historical time series for these estimates, see the following data tables in BEA’s Interactive Data Application .
Table 1.1.1. Percent Change From Preceding Period in Real Gross Domestic Product
Table 1.5.2. Contributions to Percent Change in Real Gross Domestic Product, Expanded Detail
Table 1.4.1. Percent Change From Preceding Period in Real Gross Domestic Product, Real Gross Domestic Purchases, and Real Final Sales to Domestic Purchasers
Table 1.6.7. Percent Change From Preceding Period in Prices for Gross Domestic Purchases
Table 1.7.1. Percent Change From Preceding Period in Real GDP, Real Gross National Product, and Real Net National Product
Table 6.16D. Corporate Profits by Industry
Note. With the next release of GDP, today’s data will be superseded, and the links above will reflect the latest data. The original data featured in this release can then be accessed in BEA’s Data Archive .
2. Consists of transactions between the United States and its territories, Puerto Rico, and the Northern Mariana Islands. The treatment of U.S. territories, Puerto Rico, and the Northern Mariana Islands in the National Income and Product Accounts (NIPAs) differs from that in the International Transactions Accounts (ITAs). In the NIPAs, U.S. territories are included in the rest of the world; in the ITAs, they are treated as part of the United States.