
News Release
Personal Income and Outlays, August 2026
Personal income increased $66.6 billion (0.2 percent at a monthly rate) in August, according to estimates released today by the U.S. Bureau of Economic Analysis (BEA). Disposable personal income (DPI)—personal income less personal current taxes—increased $68.6 billion (0.3 percent), and personal consumption expenditures (PCE) increased $190.8 billion (0.9 percent).
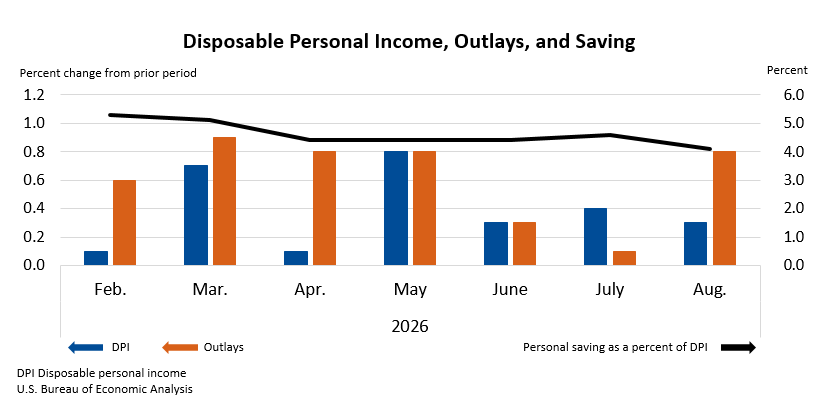
Personal outlays—the sum of PCE, personal interest payments, and personal current transfer payments—increased $190.7 billion in August. Personal saving was $990.2 billion, and the personal saving rate—personal saving as a percentage of DPI—was 4.1 percent.
The increase in current-dollar personal income in August primarily reflected increases in compensation and government social benefits.
The $190.8 billion increase in current-dollar PCE in August reflected increases of $114.1 billion in spending on goods and $76.7 billion in spending on services.
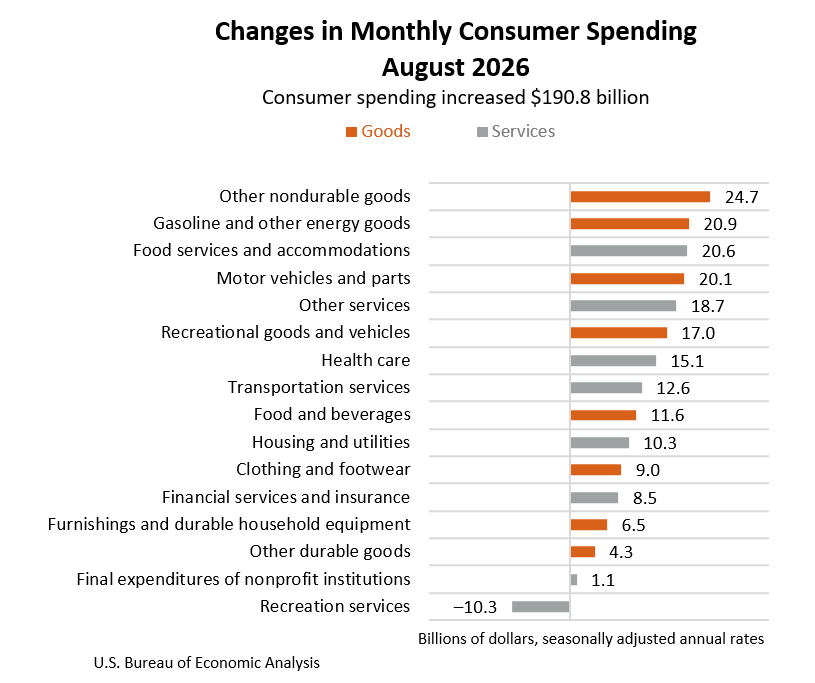
Real PCE increased $92.8 billion (0.6 percent at a monthly rate) in August.
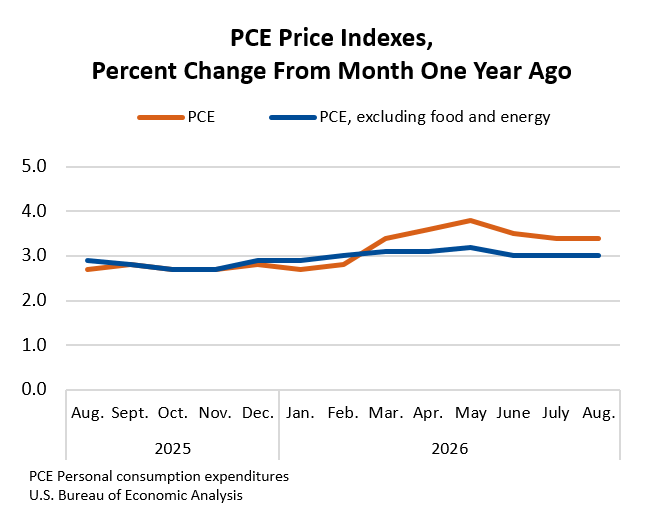
From the preceding month, the PCE price index for August increased 0.3 percent. Excluding food and energy, the PCE price index increased 0.2 percent.
From the same month one year ago, the PCE price index for August increased 3.4 percent. Excluding food and energy, the PCE price index increased 3.0 percent from one year ago.
| Personal Income and Related Measures | ||||
|---|---|---|---|---|
| July | August | |||
| Current-dollar personal income | 0.3 | 0.2 | ||
| Current-dollar DPI | 0.4 | 0.3 | ||
| Real DPI | 0.3 | 0.0 | ||
| Current-dollar PCE | 0.1 | 0.9 | ||
| Real PCE | 0.1 | 0.6 | ||
| PCE price index | 0.1 | 0.3 | ||
| PCE price index excluding food and energy | 0.1 | 0.2 | ||
Annual Update of the National Economic Accounts
Today’s release presents monthly results from the annual update of the National Economic Accounts. The revisions for estimates of personal income and outlays begin with January 2021. Refer to "Information on 2026 Annual Updates to the National, Industry, State, and County Statistics" for more information.
For definitions, statistical conventions, updates to personal income and outlays, and more information about these statistics, visit “Additional Information.”
Next release: October 29, 2026, at 8:30 a.m. EDT
Personal Income and Outlays, September 2026
Technical Notes
Changes in personal income and outlays for August
The August increase of $66.6 billion in personal income primarily reflected increases in compensation and government social benefits.
- Within compensation, the increase was led by private wages and salaries based on U.S. Bureau of Labor Statistics (BLS) Current Employment Statistics (CES).
- Within government social benefits, the leading contributors to the increase were Medicare and social security benefits, based on data from the Monthly Treasury Statement and the Budget of the U.S. Government.
Revisions to personal income
Monthly estimates for compensation for January through March of 2026 include revisions resulting from the incorporation of first-quarter wage and salary data from the BLS Quarterly Census of Employment and Wages program. Estimates for wages and salaries for April through July of 2026 have been updated to reflect revised monthly data from the BLS CES program. The revision to Medicaid benefits reflects updated information from the Centers for Medicare & Medicaid Services.
Related Data Tables
For the statistics highlighted in this release, as well as historical time series for these estimates, see the following data tables in BEA’s Interactive Data Application.
Table 2.6. Personal Income and Its Disposition
Table 2.8.1. Percent Change From Preceding Period in Real PCE by Major Type of Product
Table 2.8.5. PCE by Major Type of Product
Table 2.8.6. Real PCE by Major Type of Product
Table 2.8.7. Percent Change From Preceding Period in Prices for PCE by Major Type of Product
Table 2.8.11. Real PCE by Major Type of Product: Percent Change From Month One Year Ago
Note. With the next release, today’s data will be superseded, and the links above will reflect the latest data. The original data featured in this release can then be accessed in BEA’s Data Archive.