
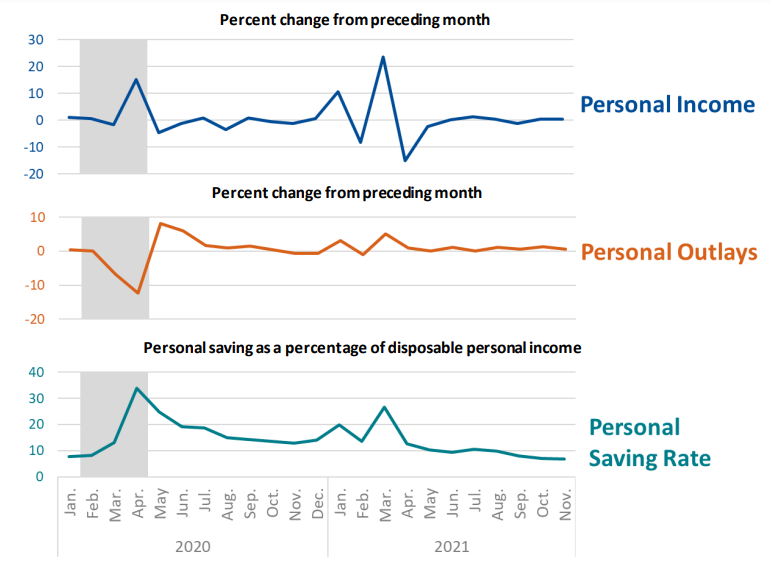
Personal income increased$90.4 billion, or 0.4 percent at a monthly rate, while consumer spending increased$104.7 billion, or 0.6 percent, in November. The increase in personal income primarily reflected increases in compensation of employees and government social benefits. The personal saving rate (that is, personal saving as a percentage of disposable personal income) was 6.9 percent in November, compared with 7.1 percent in October.
Personal income
In November, personal income increased, primarily reflecting increases in compensation of employees and government social benefits. Partly offsetting these increases was a decrease in proprietors’ income.
- Within compensation of employees, the increase primarily reflected an increase in wages and salaries, based on data from the Bureau of Labor Statistics Current Employment Statistics. Wages and salaries of services-producing industries increased $35.6 billion, while wages and salaries of goods-producing industries increased $11.0 billion.
- Within government social benefits, government transfers to nonprofit institutions serving households increased. The increase primarily reflected transfers to nonprofit institutions from the Provider Relief Fund, a pandemic-related program originally authorized by the Coronavirus Aid, Relief and Economic Security Act and extended by the American Rescue Plan Act of 2021. Additional information on factors affecting monthly personal income can be found on Effects of Selected Federal Pandemic Response Programs on Personal Income.
- Proprietors’ income declined $5.8 billion, primarily reflecting a decrease in farm proprietors’ income based on data from the Department of Agriculture Economic Research Service.
Consumer spending
Personal outlays increased in November, primarily reflecting an increase in consumer spending on services.
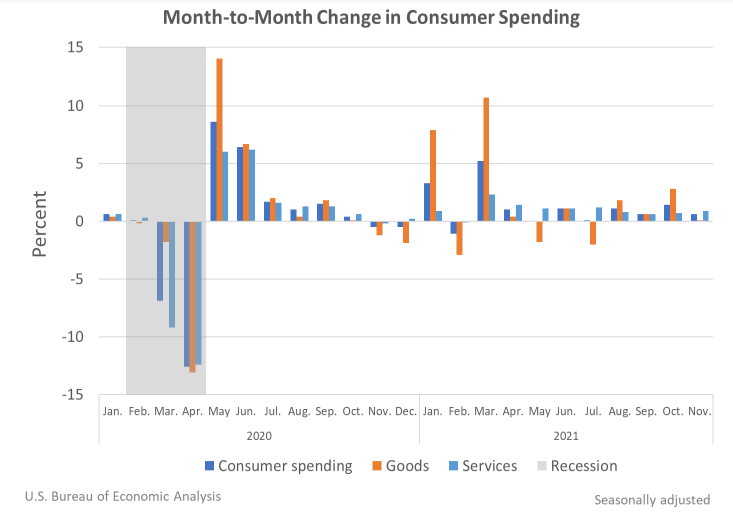
- Within services, the increase reflected increases in housing and utilities, led by electricity and gas, based on projections from the Energy Information Administration (EIA); food services and accommodations, based on data from the Census Monthly Retail Trade Survey (MRTS) as well as private data; and health care, led by outpatient services, based on data from the BLS CES as well as private data.
- Within goods, an increase in nondurable goods was partly offset by a decrease in durable goods.
- The increase in nondurable goods reflected increases in gasoline and other motor fuels, based on EIA volume data and BLS Consumer Price Indexes, as well as food and beverages, based on data from Census MRTS.
- The decrease in durable goods primarily reflected decreases in recreational goods and vehicles, led by video, audio, photographic and information processing equipment, based on data from Census MRTS, as well as motor vehicles and parts, led by new motor vehicles (light trucks), based on data from Wards Intelligence.
- The increase in nondurable goods reflected increases in gasoline and other motor fuels, based on EIA volume data and BLS Consumer Price Indexes, as well as food and beverages, based on data from Census MRTS.
PCE price index
The personal consumption expenditures price index for November increased 5.7 percent from one year ago, reflecting increases in both goods and services. Energy prices increased 34.0 percent while food prices increased 5.6 percent. Excluding food and energy, the PCE price index for November increased 4.7 percent from one year ago.
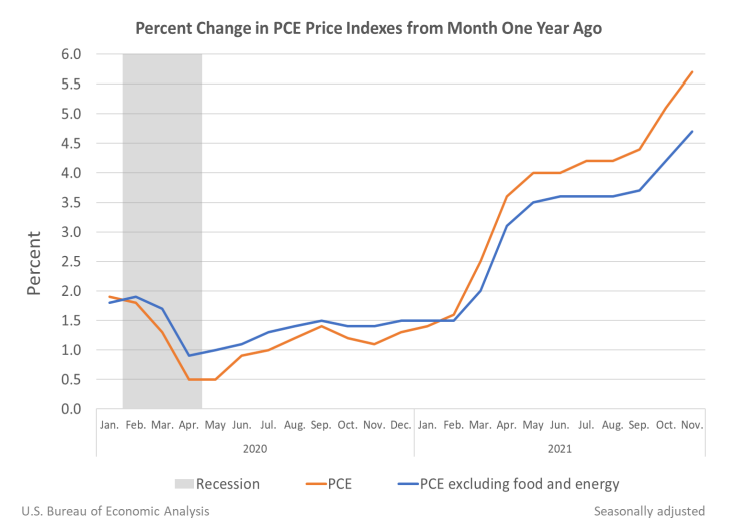
Compared to October 2021, the PCE price index increased 0.6 percent, reflecting increases in both goods and services. Energy prices increased 3.6 percent while food prices increased 0.7 percent. Excluding food and energy, the PCE price index increased 0.5 percent from October to November 2021.
For more information, read the full release.