
BEA has released a set of prototype statistics that help assess how households share in each state’s economic growth. The statistics, now available for 2022, show how personal income is distributed across each state’s households and provide metrics that can be used to study income inequality.
Personal income is one of the nation’s primary economic indicators. The Bureau of Economic Analysis began publishing statistics on distribution of U.S. personal income in 2020 as part of its GDP and Beyond initiative. Since then, BEA has continued researching data sources and methods and adding new statistics related to economic well-being, including its first state income distribution statistics last year.
In addition to new statistics for 2022, BEA on June 13, 2024, also released updated statistics for 2021, incorporating new source data. The release includes several metrics that together with other BEA statistics help paint a fuller picture of the economies of the 50 states and the District of Columbia, showing not just what happened to aggregate personal income, but how households fared across the income distribution.
The statistics include state rankings by mean and median personal income, before and after adjusting for inflation and regional price differences.
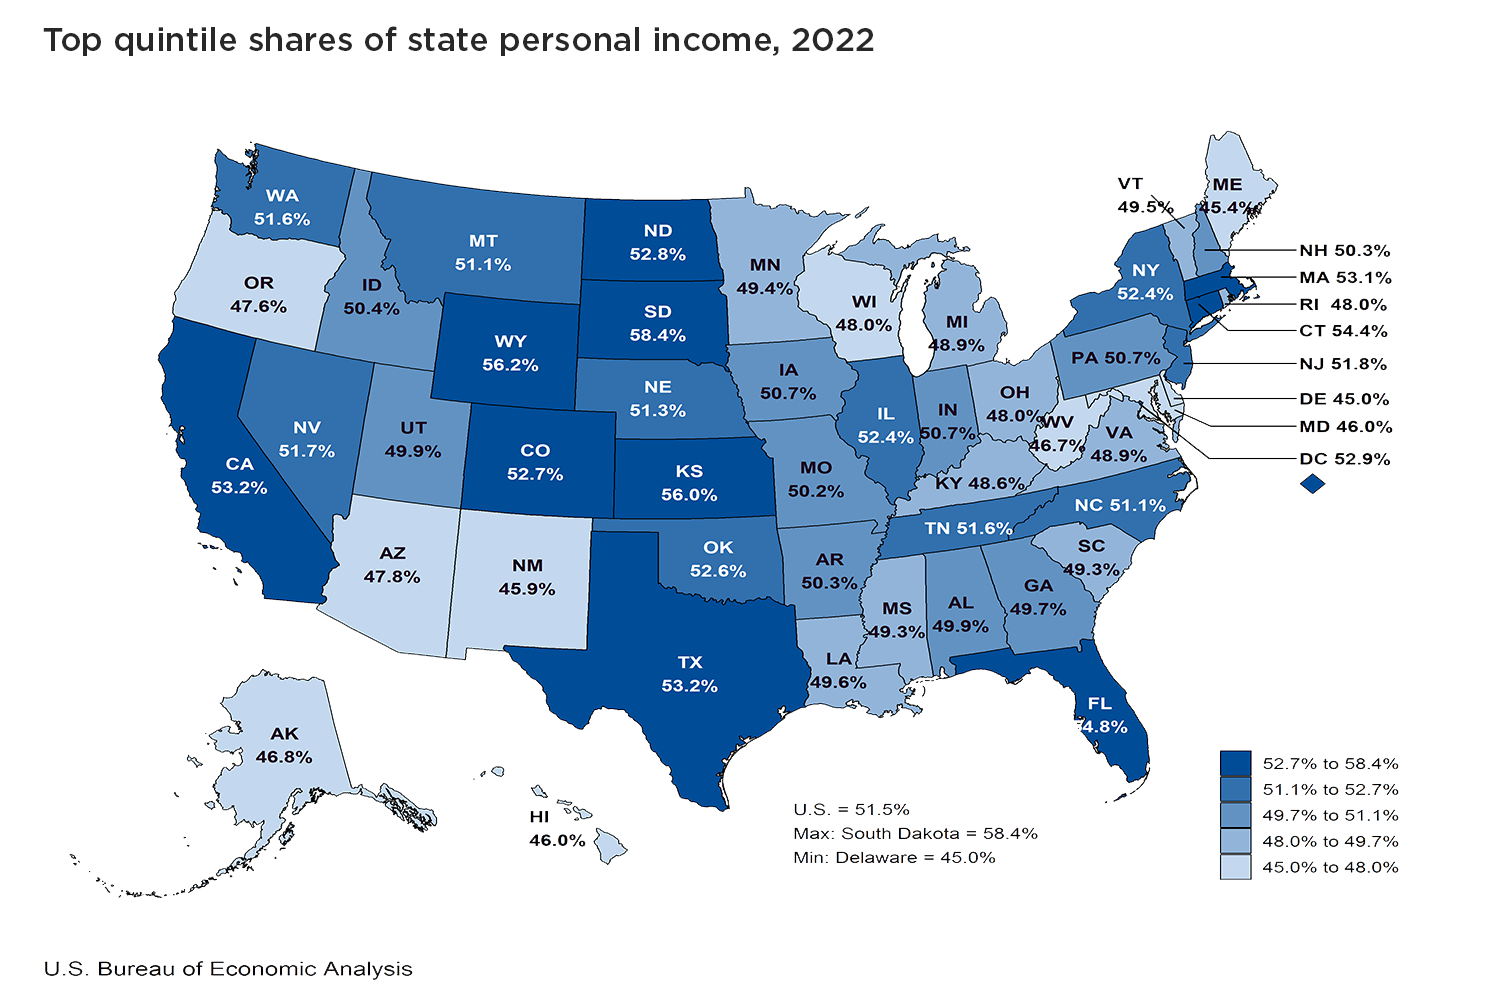
They also show personal income by quintile, or five groups representing households divided by income into equal sections, from highest to lowest income. For 2022, the states with the largest share of income going to the top quintile, or highest income group, are South Dakota, Wyoming, Kansas, Florida, and Connecticut. The states with the lowest share of income going to the top quintile are Delaware, Maine, New Mexico, Maryland, and Hawaii.
Another statistic in this release is median income – the level at which half of households earn more and half of households earn less. In 2022, household median income was highest in Maryland, Massachusetts, and California, and lowest in Mississippi, Arkansas, and Kentucky.
Also reported is the median after adjusting for differences in state-level prices. This tends to narrow the gap in median income across states. After this adjustment is made using BEA’s Regional Price Parities, the states with the highest adjusted median incomes are Maryland, Alaska, and Utah, while the lowest three are South Carolina, Mississippi, and Florida.
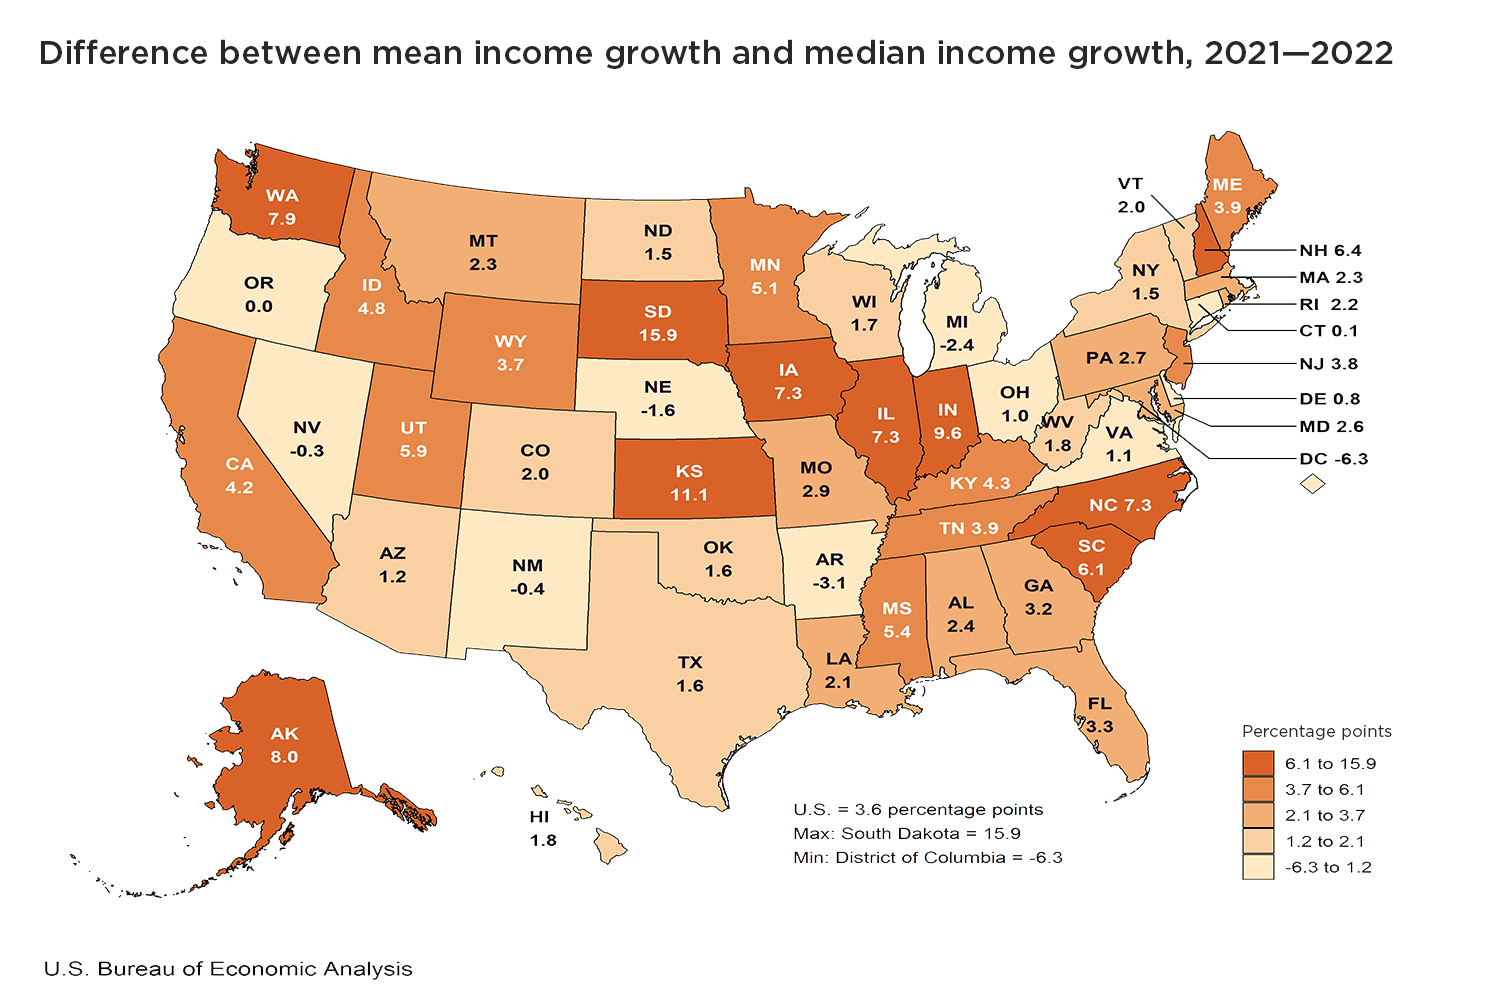
Median income is different from mean or average income. A simple way to assess changes in the states’ distributions of income over time is by comparing their mean and median incomes.
Because increases in income among households with high incomes generally lead to increases in mean income but not in median income, faster growth of mean income relative to median income indicates an increase in inequality. Between 2021 and 2022, growth in mean personal income exceeded growth in median personal income in 44 states, consistent with an increase in inequality. In the District of Columbia and five states – Arkansas, Michigan, Nebraska, New Mexico, and Nevada – median personal income grew faster, pointing to a decrease in inequality. In Oregon the rates of change were about the same.
Distribution of personal income statistics by state for 2012-2022, detailed descriptions of the concepts and methods used in their construction, and information about related research are available on bea.gov.
BEA is seeking feedback as we refine the methodology and presentation of these prototype statistics. Please direct comments or questions to stateincomedistribution@bea.gov.