
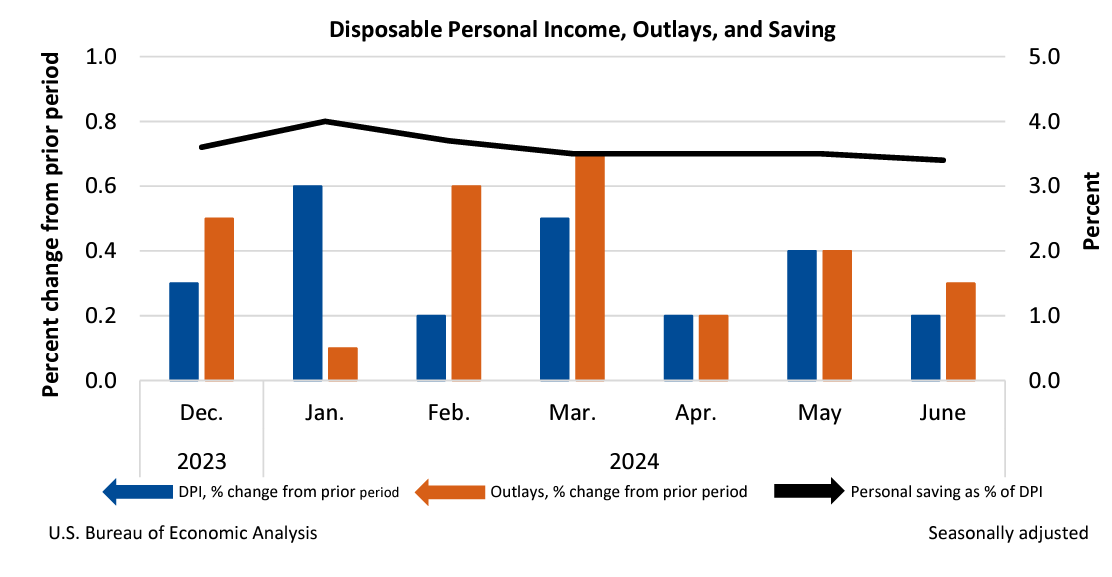
Personal income increased $50.4 billion (0.2 percent at a monthly rate) in June. Disposable personal income (DPI)—personal income less personal current taxes—increased $37.7 billion (0.2 percent). Personal outlays—the sum of personal consumption expenditures, personal interest payments, and personal current transfer payments—increased $59.3 billion (0.3 percent) and consumer spending increased $57.6 billion (0.3 percent). Personal saving was $703.0 billion and the personal saving rate—personal saving as a percentage of disposable personal income—was 3.4 percent in June.
Personal Income
The increase in personal income in June primarily reflected increases in compensation and government social benefits.
- Within compensation, the increase was led by private wages and salaries, based on data from the Bureau of Labor Statistics’ (BLS) Current Employment Statistics (CES). Services-producing industries increased $13.5 billion and goods-producing industries increased $11.6 billion.
- Within government social benefits, Medicare and social security benefits led the increase.
Consumer spending
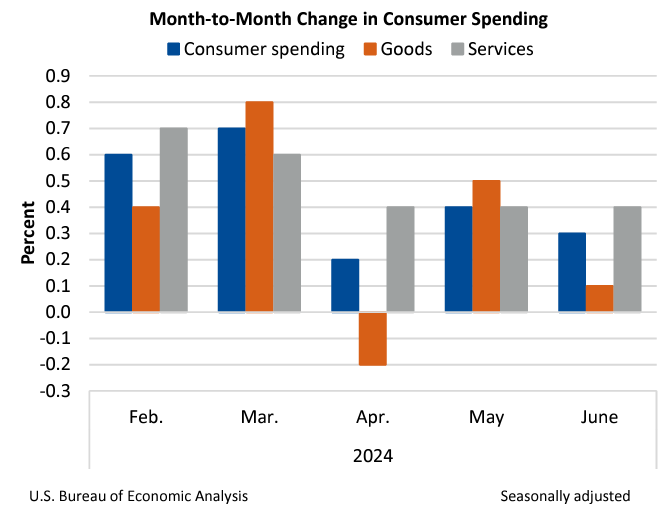
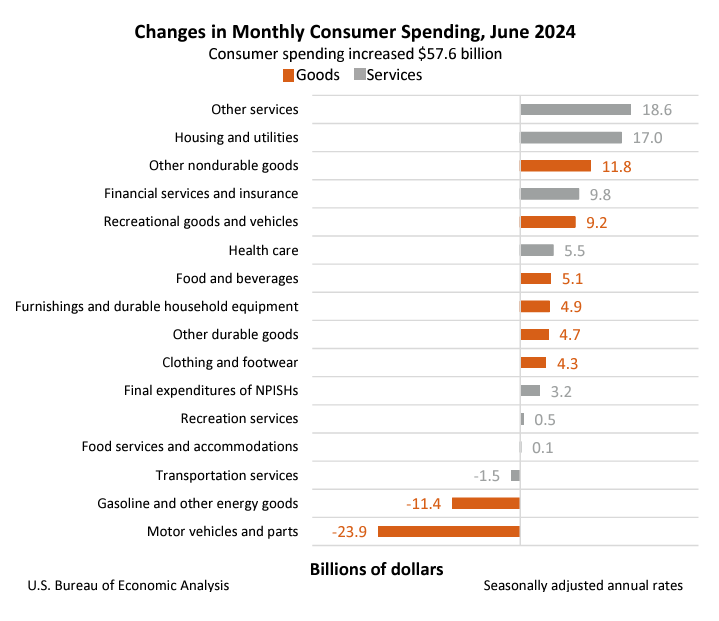
The $57.6 billion increase in consumer spending in June reflected an increase in spending for both services and goods.
- Within services, the largest contributors to the increase were other services (led by international travel), based primarily on data from BEA’s International Transactions Accounts, and housing and utilities (led by housing).
- Within goods, the largest contributors to the increase were other nondurable goods (led by pharmaceutical and other medical products) and recreational goods and vehicles (led by information processing equipment), based on Census Bureau Monthly Retail Sales data. These increases were partly offset by decreases in motor vehicles and parts (led by new motor vehicles), based on Wards Intelligence unit sales data, and gasoline and other energy goods, based on projections from the Energy Information Administration.
PCE price index
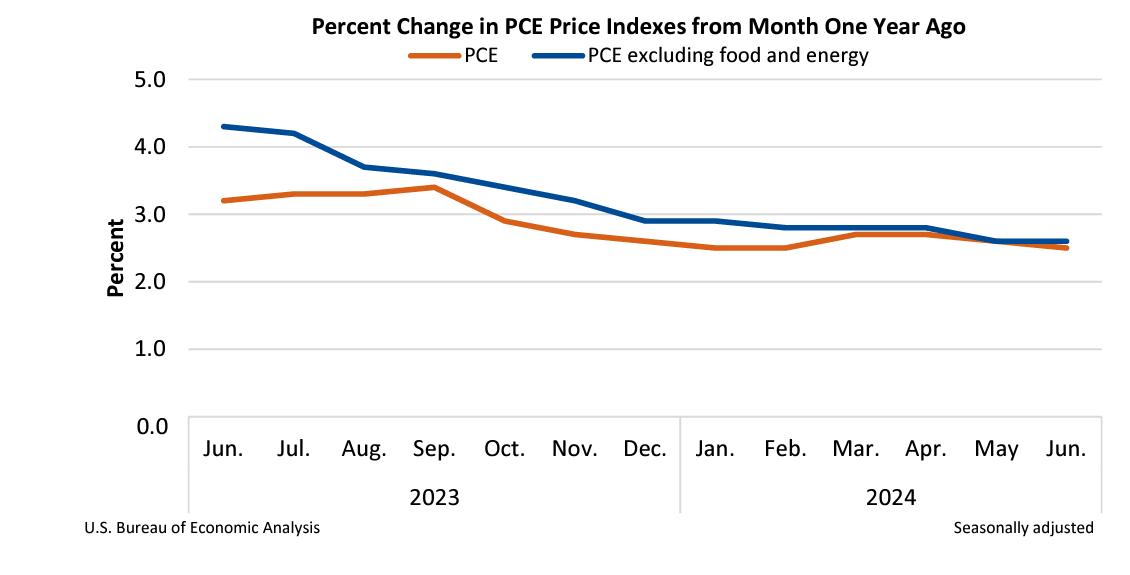
From the preceding month, the PCE price index for June increased 0.1 percent. Prices for goods decreased 0.2 percent, and prices for services increased 0.2 percent. Food prices increased 0.1 percent and energy prices decreased 2.1 percent. Excluding food and energy, the PCE price index increased 0.2 percent. For a comparison of PCE prices to BLS consumer price indexes, refer to Table 9.1U. Reconciliation of Percent Change in the CPI with Percent Change in the PCE Price Index.
From the same month one year ago, the PCE price index for June increased 2.5 percent. Prices for goods decreased 0.2 percent and prices for services increased 3.9 percent. Food prices increased 1.4 percent and energy prices increased 2.0 percent. Excluding food and energy, the PCE price index increased 2.6 percent from one year ago.
Real disposable personal income and consumer spending
Real DPI increased 0.1 percent in June. Real consumer spending increased 0.2 percent, reflecting a 0.2 percent increase in spending on goods and a 0.2 percent increase in spending on services. Within goods, the largest contributor to the increase was recreational goods and vehicles (led by information processing equipment). Within services, the largest contributor to the increase was housing and utilities.
For more information, read the full release.