
News Release
New Foreign Direct Investment in the United States, 2023
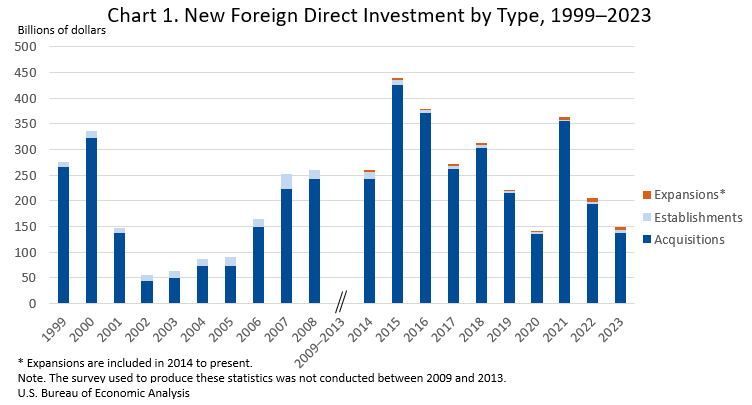
Expenditures by foreign direct investors to acquire, establish, or expand U.S. businesses totaled $148.8 billion in 2023 (chart 1), according to preliminary statistics released today by the U.S. Bureau of Economic Analysis. Expenditures decreased $57.4 billion, or 28 percent, from $206.2 billion (revised) in 2022 and were below the annual average of $265.6 billion for 2014–2022. As in previous years, acquisitions of existing U.S. businesses accounted for most of the expenditures.
In 2023, expenditures for acquisitions were $136.5 billion, expenditures to establish new U.S. businesses were $7.4 billion, and expenditures to expand existing foreign-owned businesses were $5.0 billion. Planned total expenditures, which include both first-year and planned future expenditures, were $175.9 billion (table 1.2).
In 2023, employment at newly acquired, established, or expanded foreign-owned businesses in the United States was 110,000 employees (table 4.2).
Expenditures by industry, country, and state (tables 1.2, 2.2, and 3.2)
By industry, expenditures for new direct investment were largest in transportation and warehousing, but its value is suppressed due to confidentiality requirements1. The manufacturing sector, at $42.9 billion, accounted for 28.8 percent of total expenditures. Within manufacturing, expenditures were largest in chemical manufacturing ($17.8 billion) and electrical equipment, appliances, and components ($6.6 billion). There were also notable expenditures in professional, scientific, and technical services ($16.0 billion).
The country2 with the largest investment was Canada, with expenditures of $53.4 billion. Japan ($14.6 billion) was second, followed by Sweden ($8.4 billion). By region, Europe contributed 33.8 percent of new investment in 2023.
By state, Missouri received the most investment in 2023, but its value is suppressed due to confidentiality requirements. California received the second-most investment ($12.8 billion), followed by New Jersey ($12.1 billion) and Texas ($10.1 billion).
Greenfield expenditures (tables 1.2, 2.2, and 3.2)
Greenfield investment expenditures—expenditures to establish a new U.S. business or to expand an existing foreign-owned U.S. business—were $12.4 billion in 2023. By industry, greenfield expenditures were largest in manufacturing, totaling $8.9 billion, led by electrical equipment, appliances, and components ($2.7 billion), which includes batteries. By region of investor, Asia and Pacific ($8.8 billion) and Europe ($2.1 billion) had the largest expenditures. By U.S. region, the Southeast received the highest level of greenfield investment ($6.0 billion)3.
Total planned expenditures for greenfield investment initiated in 2023, which include both first-year and future expenditures, were $39.5 billion. By industry, total planned expenditures for greenfield investment were largest in manufacturing, with expenditures of $35.1 billion, primarily electrical equipment, appliances, and components, which includes batteries. By region of investor, Asia and Pacific had the largest total planned expenditures. By U.S. region, the Southeast had the largest total planned expenditures.
Employment by newly acquired, established, or expanded foreign-owned businesses (tables 4.2, 5.2, and 6.2)
In 2023, current employment of acquired enterprises was 106,100. Total planned employment, which includes the current employment of acquired enterprises, the planned employment of newly established business enterprises when fully operational, and the planned employment associated with expansions, was 132,500.
By industry, manufacturing accounted for the largest number of current employees (25,100). Within manufacturing, employment was largest in food manufacturing (7,900) and chemicals manufacturing (5,200). By country, Canada (28,000), the United Kingdom (23,500), and Germany (13,000) accounted for the largest number of employees. By state, California (12,800) had the largest employment resulting from new investment, followed by Texas (8,200) and New York (7,900).
| Previously Published Estimate | Revised Estimate | |
|---|---|---|
| First-year expenditures | 177.5 | 206.2 |
| U.S. businesses acquired | 169.4 | 193.1 |
| U.S. businesses established | 3.8 | 5.2 |
| U.S. businesses expanded | 4.4 | 7.9 |
| Planned total expenditures | 255.1 | 292.4 |
| U.S. businesses acquired | 169.4 | 193.1 |
| U.S. businesses established | 28.2 | 31.0 |
| U.S. businesses expanded | 57.6 | 68.3 |
| U.S. Bureau of Economic Analysis | ||
Next release: July 2025
New Foreign Direct Investment in the United States, 2024
1 BEA is required by law to publish its survey-based statistics in a manner that does not disclose the identity of any survey respondent.
2 As measured by country of ultimate beneficial owner (UBO; see Additional Information for a description).
3 U.S. region is highlighted rather than U.S. state due to confidentiality requirements.