
News Release
Gross Domestic Product by State, Advance 2009 and Revised 1963-2008
EMBARGOED UNTIL RELEASE AT 8:30 A.M. EST, THURSDAY, NOVEMBER 18, 2010
| Technical: Clifford Woodruff | (202) | 606–9234 | |
| Media: Ralph Stewart | (202) | 606–2649 | BEA 10—53 |
| E–mail inquiries: | gdpbystate@bea.gov |
ECONOMIC DOWNTURN WIDESPREAD AMONG STATES IN 2009
Real GDP declined in 38 states in 2009, led by national downturns in durable–goods manufacturing and construction, according to new statistics that breakdown GDP by state released today by the U.S. Bureau of Economic Analysis.1 U.S. real GDP by state declined 2.1 percent in 2009 after increasing 0.1 percent in 2008.2
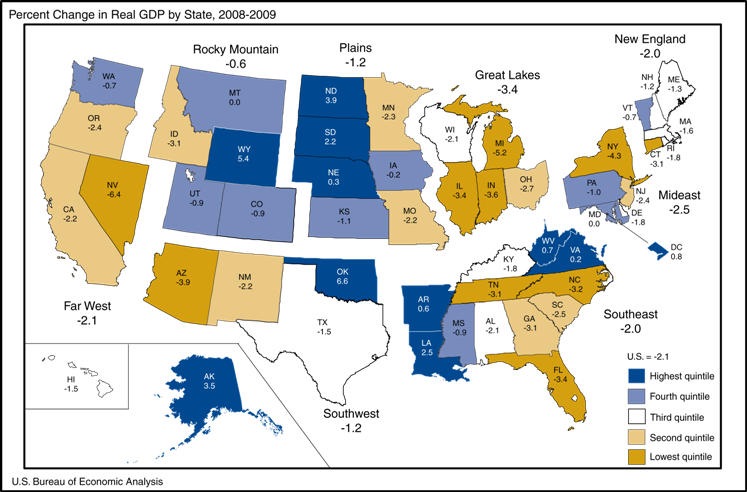
Real GDP declined in all eight BEA regions in 2009. The sharpest downturn was in the Great Lakes region where the decline in real GDP accelerated to 3.4 percent in 2009 from a decline of 0.6 percent in 2008. Real GDP declined in 2009 in all five states of the Great Lakes region, led by Michigan with a decline of 5.2 percent.
Durable–goods manufacturing and construction led the decline in real U.S. GDP by state in 2009. One of these two industries was the leading contributor to the decline in 34 states. The states hardest hit by the decline in durable–goods manufacturing were Michigan, Indiana, Ohio, Wisconsin, Tennessee, and Kentucky. The decline in construction subtracted more than one percentage point from growth in Nevada, Arizona, and Idaho, and nearly subtracted a point in Florida. In addition to the decline in construction, declines in accommodation and food services, and real estate, rental, and leasing, caused Nevada to have the largest downturn in 2009 (–6.4 percent).
In contrast to the nation and most states, several states experienced positive real GDP growth in 2009 due to real growth in agriculture, forestry, fishing, and hunting and in mining resulting from sharp declines in prices for petroleum, natural gas, and other mining products in 2009. Oklahoma had the fastest growth in real GDP in 2009 (6.6 percent). The largest contributor to growth in Oklahoma was mining. Mining was also the leading contributor to growth in Wyoming and Louisiana. Agriculture, forestry, fishing, and hunting was the leading contributor to growth in North Dakota and Nebraska, and was the second largest contributor to growth in South Dakota.
Per capita real GDP by state in 2009. Delawares per capita real GDP of $62,080 was the highest in the nation, 48 percent above the national average. Mississippis per capita real GDP of $29,634 was the lowest in the nation, 29 percent below the national average. Nine of the 10 states in both the top and bottom quintile remained the same in 2008 and 2009. Washington replaced Colorado in the highest quintile in 2009, while Michigan replaced Maine in the lowest quintile in 2009. Refer to Table 3 for more detail on the results of per capita real GDP by state.
Tables 1–4 show these results in more detail; complete detail is available on BEAs Web site at www.bea.gov.
The next release of GDP by state is scheduled for June 7, 2011. This release will include revised statistics for 2007–2009 and advance statistics for 2010. The revised statistics will incorporate the results of the July 2010 annual revision of the NIPAs and the next release of revised and advance GDP–by–industry statistics.
Comprehensive Revision of Gross Domestic Product by State
The statistics released today reflect the results of the comprehensive revision of gross domestic product (GDP) by state for 1963–2008. This revision incorporates significant changes in classification and statistical methods to more accurately portray the state economies. Significant changes introduced with this revision include:
- Updated industry definitions consistent with the 2002 North American Industry Classification System (NAICS).
- The results of the 2009 comprehensive revision of the national income and product accounts, the 2010 comprehensive revision of the annual industry accounts, and the 2009 comprehensive revision of state personal income.
- Use of new data sources to better allocate national economic activity across states for utilities, air transportation, freight rail transportation, and state and local government.
- Improved use of Economic Census data on tax–exempt establishments to allocate national economic activity across states for services–producing industries.
- Improved statistical methods for the federal enterprises of flood and crop insurance to improve consistency with the national income and product accounts.
More information on this revision will be available in the December Survey of Current Business.
The advance statistics of GDP by state for 2009 are based on a more limited set of source data and an abbreviated estimation methodology compared with the standard set of data and the estimation methodology used to prepare the revised NAICS statistics for 1997–2008. The advance GDP–by–state statistics are based primarily on earnings by industry data from BEAs regional economic accounts, released September 20, 2010, and on advance GDP–by–industry data from BEAs annual industry accounts, released May 25, 2010. Preliminary farm sector cash receipts data from the U.S. Department of Agriculture are incorporated in the agriculture, forestry, fishing, and hunting sector. Preliminary value of production and price data from the U.S. Department of the Interior and the U.S. Department of Energy are incorporated in the mining sector.
More information on the methodology used to produce the advance 2009 statistics, on the revised GDP–by–state statistics for 1997–2008, and on revisions to the GDP–by–state statistics will appear in an article in the December 2010 issue of the Survey of Current Business, BEAs monthly journal.
Definitions. GDP by state is the state counterpart of the Nations gross domestic product (GDP), the Bureaus featured and most comprehensive measure of U.S. economic activity. GDP by state is derived as the sum of the GDP originating in all the industries in a state.
The statistics of real GDP by state are prepared in chained (2005) dollars. Real GDP by state is an inflation–adjusted measure of each states gross product that is based on national prices for the goods and services produced within that state. The statistics of real GDP by state and of quantity indexes with a base year of 2005 were derived by applying national chain–type price indexes to the current–dollar GDP–by–state values for the 64 detailed NAICS–based industries for 1997 forward and for the 63 detailed SIC–based industries for 1977–1997.
The chain–type index formula that is used in the national accounts is then used to calculate the values of total real GDP by state and of real GDP by state at more aggregated industry levels. Real GDP by state may reflect a substantial volume of output that is sold to other states and countries. To the extent that a states output is produced and sold in national markets at relatively uniform prices (or sold locally at national prices), real GDP by state captures the differences across states that reflect the relative differences in the mix of goods and services that the states produce. However, real GDP by state does not capture geographic differences in the prices of goods and services that are produced and sold locally.
BEA is working toward a long–term goal of replacing the national implicit price deflators used to deflate state–level current–dollar GDP by industry with state–specific prices. A paper posted on BEAs Web site, Estimates of State and Metropolitan Price Levels for Consumption Goods and Services in the United States, 2005, by Bettina H. Aten (/papers/pdf/aten_estimates_state_metro_2005.pdf) presents estimates of spatial price deflators that may be used for adjusting price level differences across geographic areas. The work is based on micro–level price data from the consumer price index of the U.S. Bureau of Labor Statistics and the American Community Survey of the U.S. Census Bureau. It represents an important first step in deriving producer–type price indexes—which are the basis for the national implicit price deflators used in BEAs GDP–by–state accounts—at the state level. BEA plans to continue research into developing state–level prices and to explore estimating GDP by state on an expenditures basis.
Relation of GDP by state to U.S. Gross Domestic Product (GDP). An industry's GDP by state, or its value added, in practice, is calculated as the sum of incomes earned by labor and capital and the costs incurred in the production of goods and services. That is, it includes the wages and salaries that workers earn, the income earned by individual or joint entrepreneurs as well as by corporations, and business taxes such as sales, property, and Federal excise taxes—that count as a business expense.
GDP is calculated as the sum of what consumers, businesses, and government spend on final goods and services, plus investment and net foreign trade. In theory, incomes earned should equal what is spent, but due to different data sources, income earned, usually referred to as gross domestic income (GDI), does not always equal what is spent (GDP). The difference is referred to as the "statistical discrepancy."
Starting with the 2004 comprehensive revision, BEAs annual industry accounts and its GDP–by–state accounts allocate the statistical discrepancy across all private–sector industries. Therefore, the GDP–by–state statistics are now conceptually more similar to the GDP statistics in the national accounts than they had been in the past.
U.S. real GDP by state for the advance year, 2009, may differ from the Annual Industry Accounts GDP by industry and, hence NIPA (National Income and Product Account) GDP, because of different sources and vintages of data used to estimate GDP by state and NIPA GDP. For the revised years of 19972008, U.S. GDP by state is nearly identical to GDP by industry except for small differences resulting from the GDP–by–state accounts exclusion of overseas Federal military and civilian activity (because it cannot be attributed to a particular state). The GDP–by–industry statistics are identical to those from the 2009 comprehensive revision of the NIPAs, released in July 2009. However, because of revisions since July 2009, GDP in the NIPAs may differ from U.S. GDP by state.
BEA's national, international, regional, and industry estimates; the Survey of Current Business; and BEA news releases are available without charge on BEA's Web site at www.bea.gov. By visiting the site, you can also subscribe to receive free e–mail summaries of BEA releases and announcements.
1. Real GDP by state is an inflation–adjusted measure of each state's production, wherever sold. For a further description, see the "Explanatory Notes" section in this release.
2. For an explanation of the relation between real GDP by state and real GDP in the national income and product accounts (NIPAs), see the section "Relation of GDP by state to U.S. Gross Domestic Product."
Last updated: Thursday, November 18, 2010