
News Release
U.S. International Transactions, 1st Quarter 2024 and Annual Update
Current-Account Deficit Widened by 7.2 Percent in First Quarter
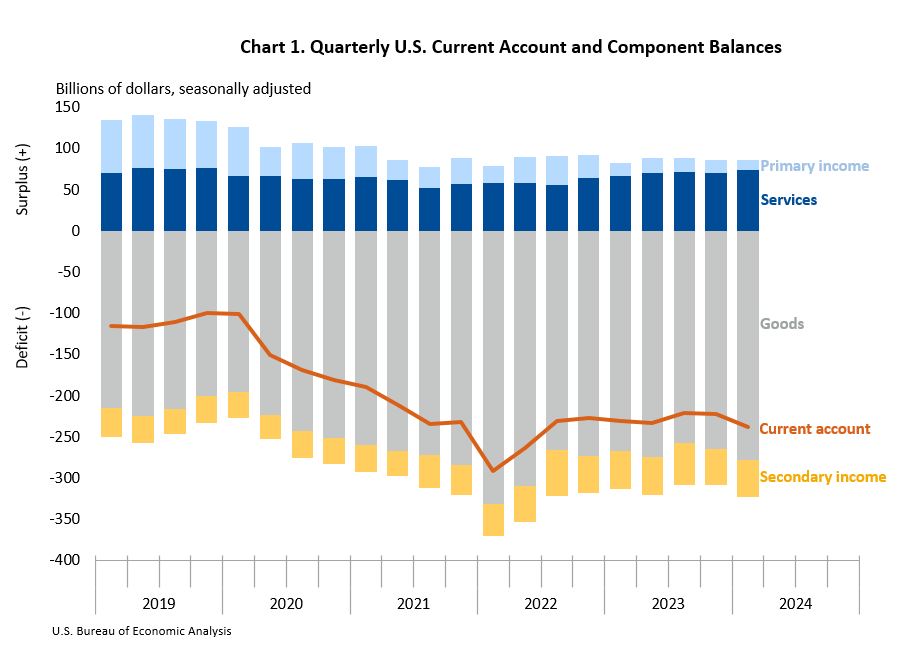
Current-Account Balance (chart 1)
The U.S. current-account deficit, which reflects the combined balances on trade in goods and services and income flows between U.S. residents and residents of other countries, widened by $15.9 billion, or 7.2 percent, to $237.6 billion in the first quarter of 2024, according to statistics released today by the U.S. Bureau of Economic Analysis (BEA). The revised fourth-quarter deficit was $221.8 billion.
The first-quarter deficit was 3.4 percent of current-dollar gross domestic product, up from 3.2 percent in the fourth quarter.
The $15.9 billion widening of the current-account deficit in the first quarter mostly reflected an expanded deficit on goods.
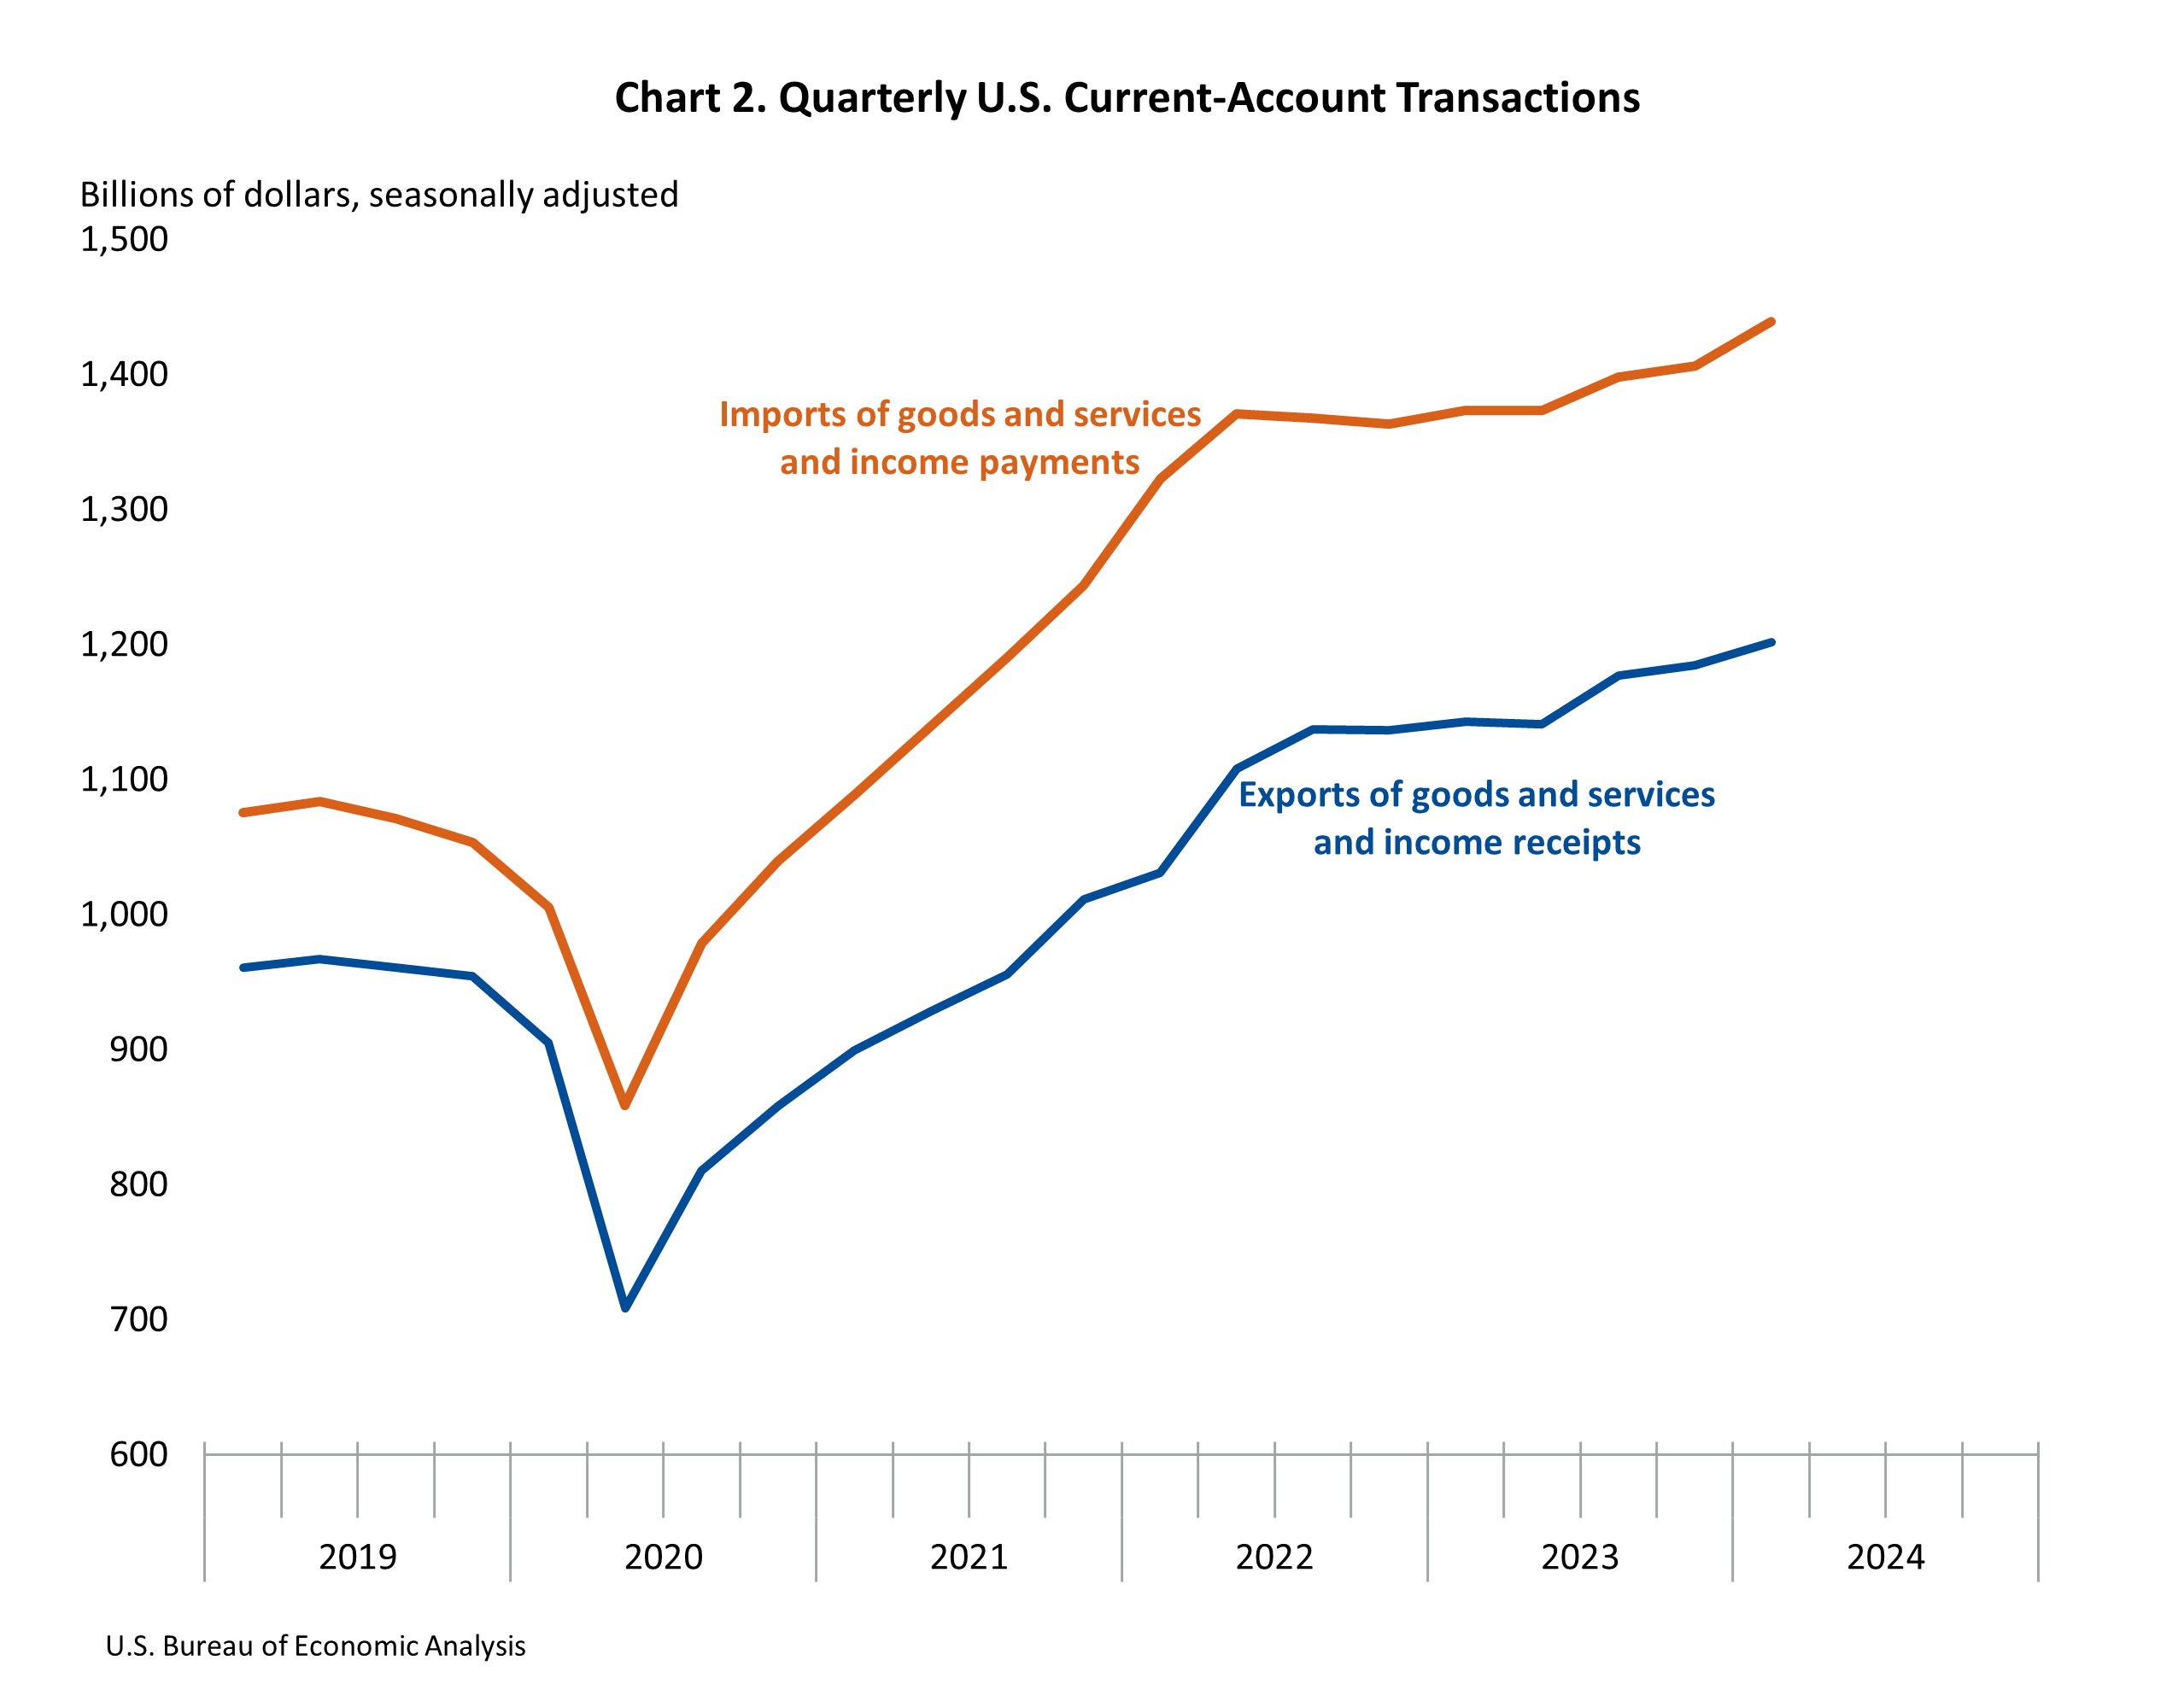
Current-Account Transactions (tables 1–5 and chart 2)
Exports of goods and services to, and income received from, foreign residents increased $17.0 billion to $1.20 trillion in the first quarter. Imports of goods and services from, and income paid to, foreign residents increased $32.9 billion to $1.44 trillion.1
Trade in goods (table 2)
Exports of goods increased $2.3 billion to $516.1 billion, reflecting increases in nonmonetary gold; in capital goods, led by civilian aircraft engines and parts and by computer accessories, peripherals, and parts; and in foods, feeds and beverages, led by soybeans. These increases in exports of goods were partly offset by a decrease in industrial supplies and materials, led by chemicals. Imports of goods increased $15.4 billion to $793.9 billion, reflecting increases in capital goods—mostly computers; other industrial machinery; and computer accessories, peripherals, and parts—and increases in consumer goods—mostly apparel, footwear, and household goods and medicinal, dental, and pharmaceutical products. These increases in imports were partly offset by a decrease in nonmonetary gold.
Trade in services (table 3)
Exports of services increased $7.7 billion to $271.0 billion, reflecting increases in financial services, mostly financial management services and financial intermediation services indirectly measured, and in telecommunications, computer, and information services, mostly computer services. Imports of services increased $5.1 billion to $197.8 billion, reflecting increases in transport, mainly air passenger transport, and in other business services, mainly professional and management consulting services.
Primary income (table 4)
Receipts of primary income increased $9.7 billion to $364.6 billion, and payments of primary income increased $12.9 billion to $352.3 billion. The increases in both receipts and payments reflected increases in most major categories. The increase in receipts was led by direct investment income, mostly earnings. The increase in payments was led by portfolio investment income, mostly interest on long-term debt securities.
Secondary income (table 5)
Receipts of secondary income decreased $2.7 billion to $49.7 billion, reflecting a decrease in general government transfers, mainly fines and penalties. Payments of secondary income decreased $0.5 billion to $95.1 billion, reflecting a decrease in general government transfers, mainly international cooperation, that was mostly offset by an increase in private transfers, led by taxes on income and wealth.
Capital-Account Transactions (table 1)
Capital-transfer receipts increased $29 million to $44 million in the first quarter. Capital-transfer payments increased $0.1 billion to $1.9 billion, mainly reflecting an increase in infrastructure grants.
Financial-Account Transactions (tables 1, 6, 7, and 8 and chart 3)
Net financial-account transactions were −$197.3 billion in the first quarter, reflecting net U.S. borrowing from foreign residents.
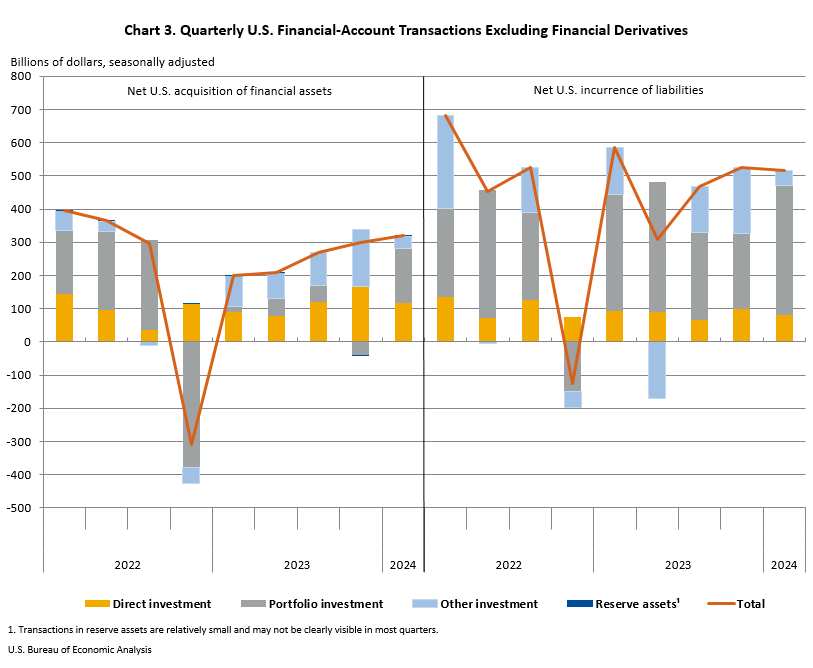
Financial assets (tables 1, 6, 7, and 8)
First-quarter transactions increased U.S. residents’ foreign financial assets by $321.2 billion. Transactions increased portfolio investment assets, both debt securities and equity, by $164.1 billion; direct investment assets, mostly equity, by $118.3 billion; other investment assets, resulting from an increase in loans that was mostly offset by a decrease in deposits, by $36.3 billion; and reserve assets by $2.5 billion.
Liabilities (tables 1, 6, 7, and 8)
First-quarter transactions increased U.S. liabilities to foreign residents by $515.6 billion. Transactions increased portfolio investment liabilities, mostly long-term debt securities, by $389.5 billion; direct investment liabilities, mostly equity, by $81.2 billion; and other investment liabilities, primarily loans, by $44.9 billion.
Financial derivatives (table 1)
Net transactions in financial derivatives were –$2.9 billion in the first quarter, reflecting net U.S. borrowing from foreign residents.
Table A. Updates to Fourth-Quarter 2023 International Transactions Accounts Balances [Billions of dollars, seasonally adjusted] | ||
|---|---|---|
| Preliminary estimates | Revised estimates | |
| Current-account balance | –194.8 | −221.8 |
| Goods balance | −264.9 | −264.6 |
| Services balance | 72.9 | 70.6 |
| Primary income balance | 36.1 | 15.5 |
| Secondary income balance | −38.9 | −43.3 |
| Net financial-account transactions | −221.1 | −235.9 |
| U.S. Bureau of Economic Analysis | ||
Annual Update of the U.S. International Transactions Accounts
The statistics in this release reflect the annual update of the U.S. International Transactions Accounts. With this update, BEA has incorporated newly available and revised source data beginning with 2020 and recalculated seasonal and trading-day adjustments beginning with 2019. This annual update also reflects the incorporation of (1) a new estimation method for sea freight exports and other improvements to sea transport services and (2) newly available source data for portfolio investment, which will result in presentational changes in table 1.3 of the International Investment Position (IIP) Accounts (see below). A summary of the revisions to high-level aggregates is shown in table 9.
Table B. Newly Available and Revised Source Data: Key Providers and Years Affected
| Agency | Data | Years affected |
|---|---|---|
| U.S. Bureau of Economic Analysis | Quarterly international trade in services surveys | 2021–2023 |
| Benchmark, annual, and quarterly direct investment surveys | 2021–2023 | |
| U.S. Census Bureau | Revised source data for international trade in goods | 2021–2023 |
| U.S. Department of the Treasury | Annual portfolio investment surveys | 2022–2023 |
| Quarterly and monthly portfolio and other investment surveys | 2022–2023 | |
| U.S. Bureau of Economic Analysis | ||
More information on the annual update is available in “Preview of the 2024 Annual Update of the International Economic Accounts” in the Survey of Current Business. Additional information will be provided in the Survey in July. U.S. International Economic Accounts: Concepts and Methods has been updated to reflect changes implemented with this annual update.
New International Investment Position Statistics
With the release of the IIP Accounts on June 26, 2024, BEA will (1) expand “Table 1.3. Change in the Yearend U.S. Net International Investment Position,” which currently presents annual statistics, to include new quarterly statistics on price changes and exchange-rate changes for U.S. assets and liabilities beginning with the first quarter of 2023 and (2) rename this table “Table 1.3. Change in the U.S. Net International Investment Position.” To prepare users for this change, a prototype of the new IIP table 1.3 is available in BEA’s Interactive Data Application and Data Application Programming Interface. More information is available in the annual update preview article in the Survey.
Next release: September 19, 2024, at 8:30 a.m. EDT
U.S. International Transactions, 2nd Quarter 2024
1 U.S. international transactions are presented in current dollars in accordance with international statistical presentation guidelines. For a comparison of current-dollar, or nominal, and inflation-adjusted, or real, measures of international transactions, see “SECTION 4 – FOREIGN TRANSACTIONS” of the National Income and Product Accounts.