BEA 26-07
Scheduled Date
January 29 08:30:am
Release Title
U.S. International Trade in Goods and Services, November 2025

An official website of the United States government
|
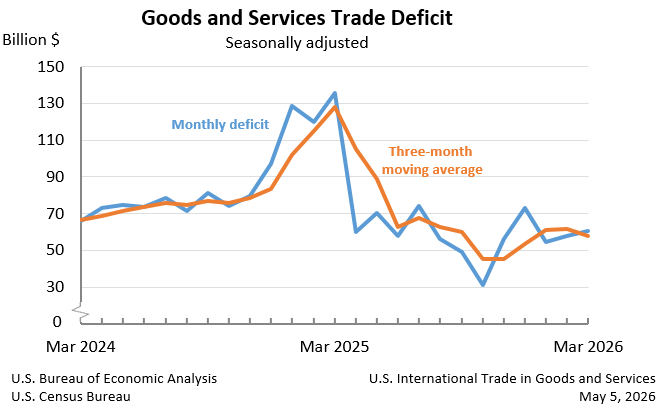
March 2026
|
-$60.3 B
|
|
February 2026
|
-$57.8 B
|
The U.S. monthly international trade deficit increased in March 2026 according to the U.S. Bureau of Economic Analysis and the U.S. Census Bureau. The deficit increased from $57.8 billion in February (revised) to $60.3 billion in March, as imports increased more than exports. The goods deficit increased $4.1 billion in March to $88.7 billion. The services surplus increased $1.6 billion in March to $28.4 billion.
|
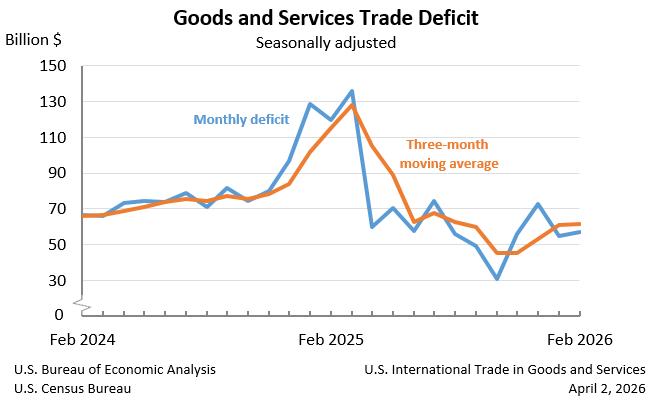
February 2026
|
-$57.3 B
|
|
January 2026
|
-$54.7 B
|
The U.S. monthly international trade deficit increased in February 2026 according to the U.S. Bureau of Economic Analysis and the U.S. Census Bureau. The deficit increased from $54.7 billion in January (revised) to $57.3 billion in February, as imports increased more than exports. The goods deficit increased $2.5 billion in February to $84.6 billion. The services surplus decreased $0.2 billion in February to $27.3 billion.
|
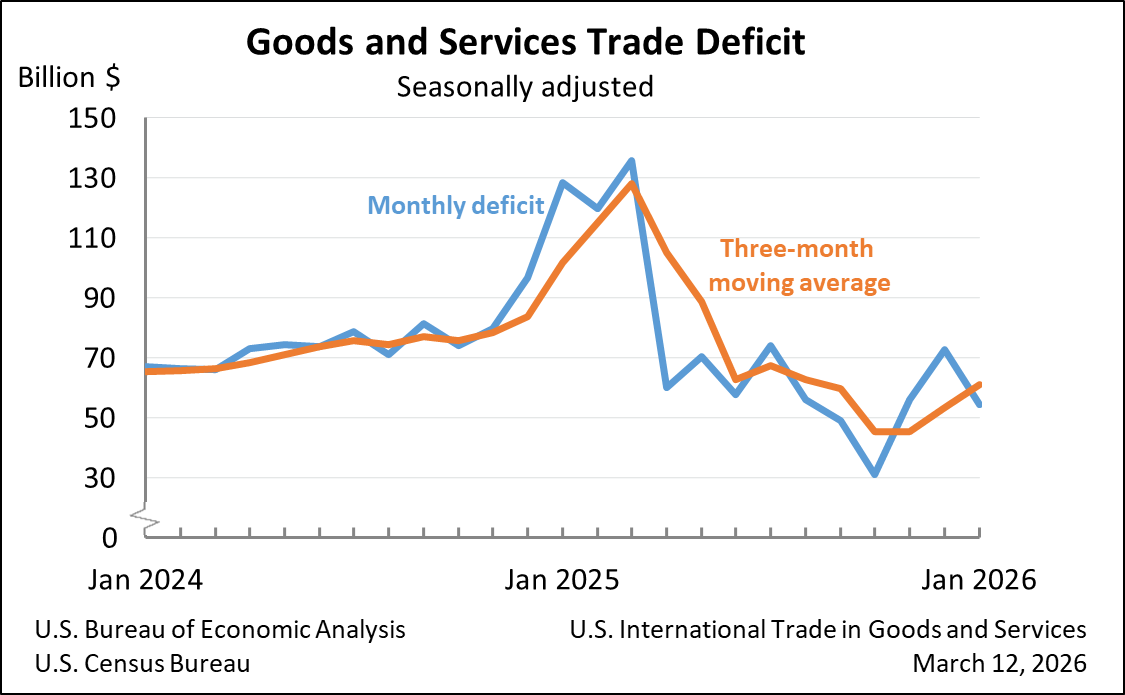
January 2026
|
-$54.5 B
|
|
December 2025
|
-$72.9 B
|
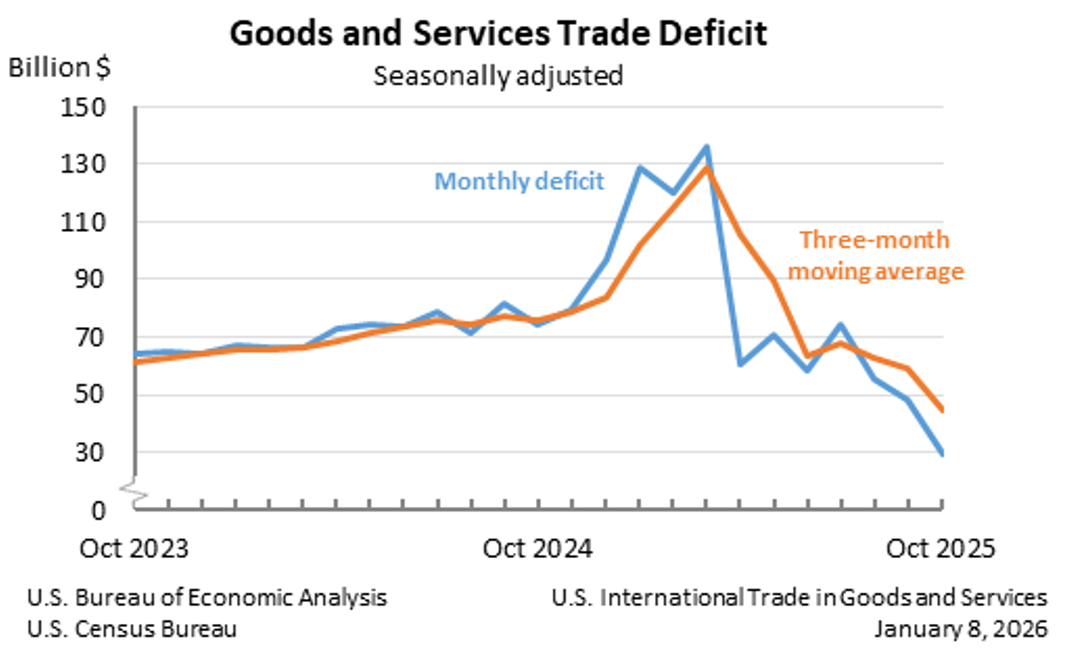
The U.S. monthly international trade deficit decreased in January 2026 according to the U.S. Bureau of Economic Analysis and the U.S. Census Bureau. The deficit decreased from $72.9 billion in December (revised) to $54.5 billion in January, as exports increased and imports decreased. The goods deficit decreased $17.5 billion in January to $81.8 billion. The services surplus increased $1.0 billion in January to $27.3 billion.
|
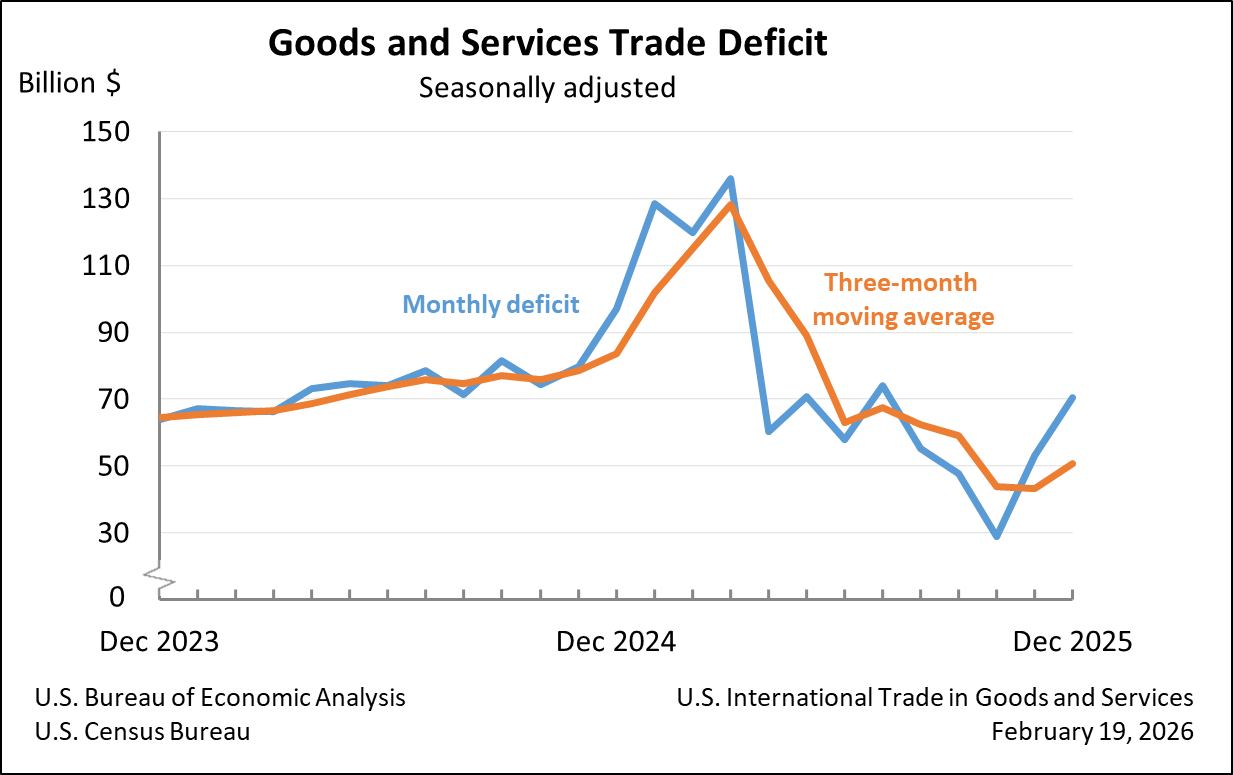
December 2025
|
-$70.3 B
|
|
November 2025
|
-$53.0 B
|
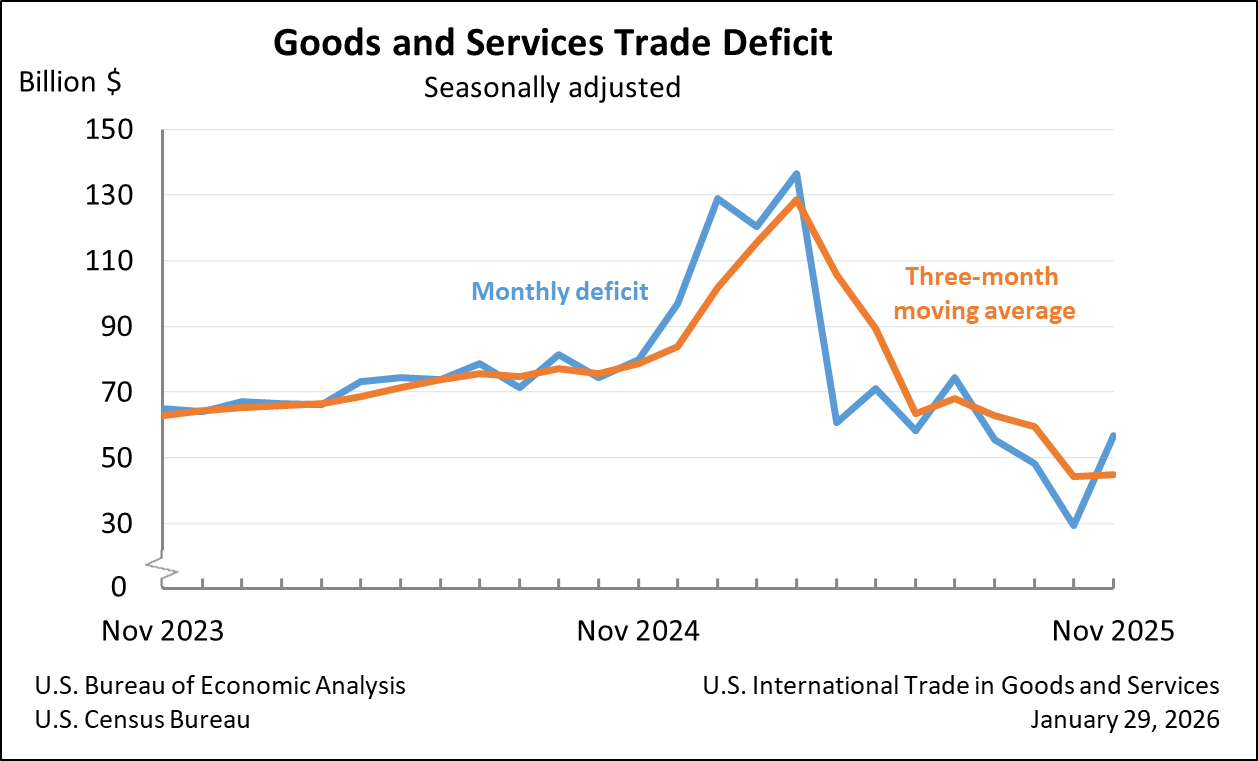
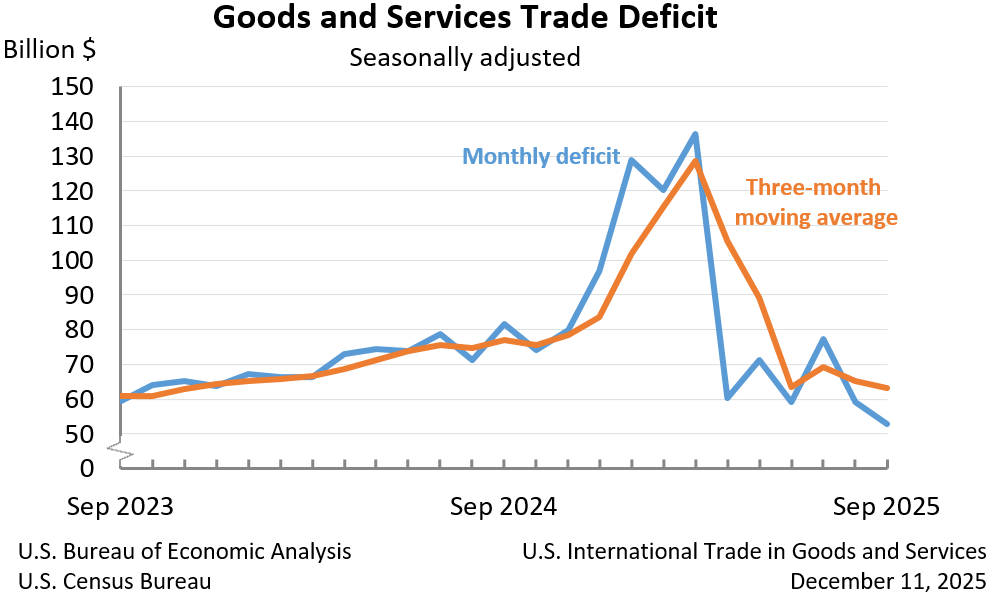
The U.S. monthly international trade deficit increased in December 2025 according to the U.S. Bureau of Economic Analysis and the U.S. Census Bureau. The deficit increased from $53.0 billion in November (revised) to $70.3 billion in December, as imports increased and exports decreased. The goods deficit increased $15.7 billion in December to $99.3 billion. The services surplus decreased $1.6 billion in December to $29.0 billion.
|
November 2025
|
-$56.8 B
|
|
October 2025
|
-$29.2 B
|
The U.S. goods and services trade deficit increased in November 2025 according to the U.S. Bureau of Economic Analysis and the U.S. Census Bureau. The deficit increased from $29.2 billion in October (revised) to $56.8 billion in November, as exports decreased and imports increased. The goods deficit increased $27.9 billion in November to $86.9 billion. The services surplus increased $0.3 billion in November to $30.1 billion.
|
October 2025
|
-$29.4 B
|
|
September 2025
|
-$48.1 B
|
The U.S. goods and services trade deficit decreased in October 2025 according to the U.S. Bureau of Economic Analysis and the U.S. Census Bureau. The deficit decreased from $48.1 billion in September (revised) to $29.4 billion in October, as exports increased and imports decreased. The goods deficit decreased $19.2 billion in October to $59.1 billion. The services surplus decreased $0.4 billion in October to $29.8 billion.
|
September 2025
|
-$52.8 B
|
|
August 2025
|
-$59.3 B
|
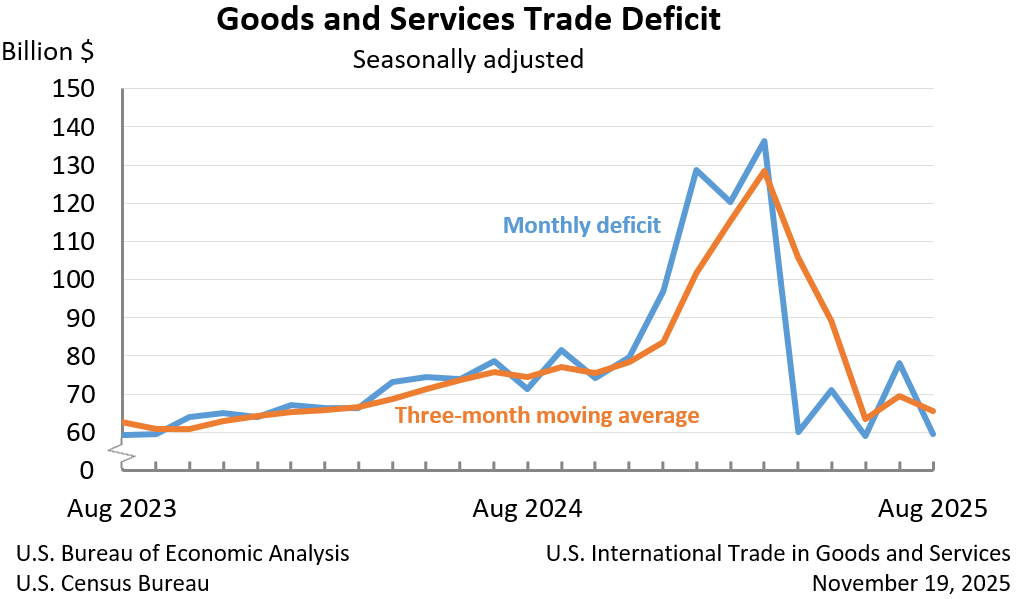
The U.S. goods and services trade deficit decreased in September 2025 according to the U.S. Bureau of Economic Analysis and the U.S. Census Bureau. The deficit decreased from $59.3 billion in August (revised) to $52.8 billion in September, as exports increased more than imports. The goods deficit decreased $7.1 billion in September to $79.0 billion. The services surplus decreased $0.6 billion in September to $26.2 billion.
|
August 2025
|
-$59.6 B
|
|
July 2025
|
-$78.2 B
|
The U.S. goods and services trade deficit decreased in August 2025 according to the U.S. Bureau of Economic Analysis and the U.S. Census Bureau. The deficit decreased from $78.2 billion in July (revised) to $59.6 billion in August, as exports increased and imports decreased. The goods deficit decreased $18.1 billion in August to $85.6 billion. The services surplus increased $0.5 billion in August to $26.1 billion.