
Bureau of Economic Analysis
Direct Investment by Country and Industry, 2025
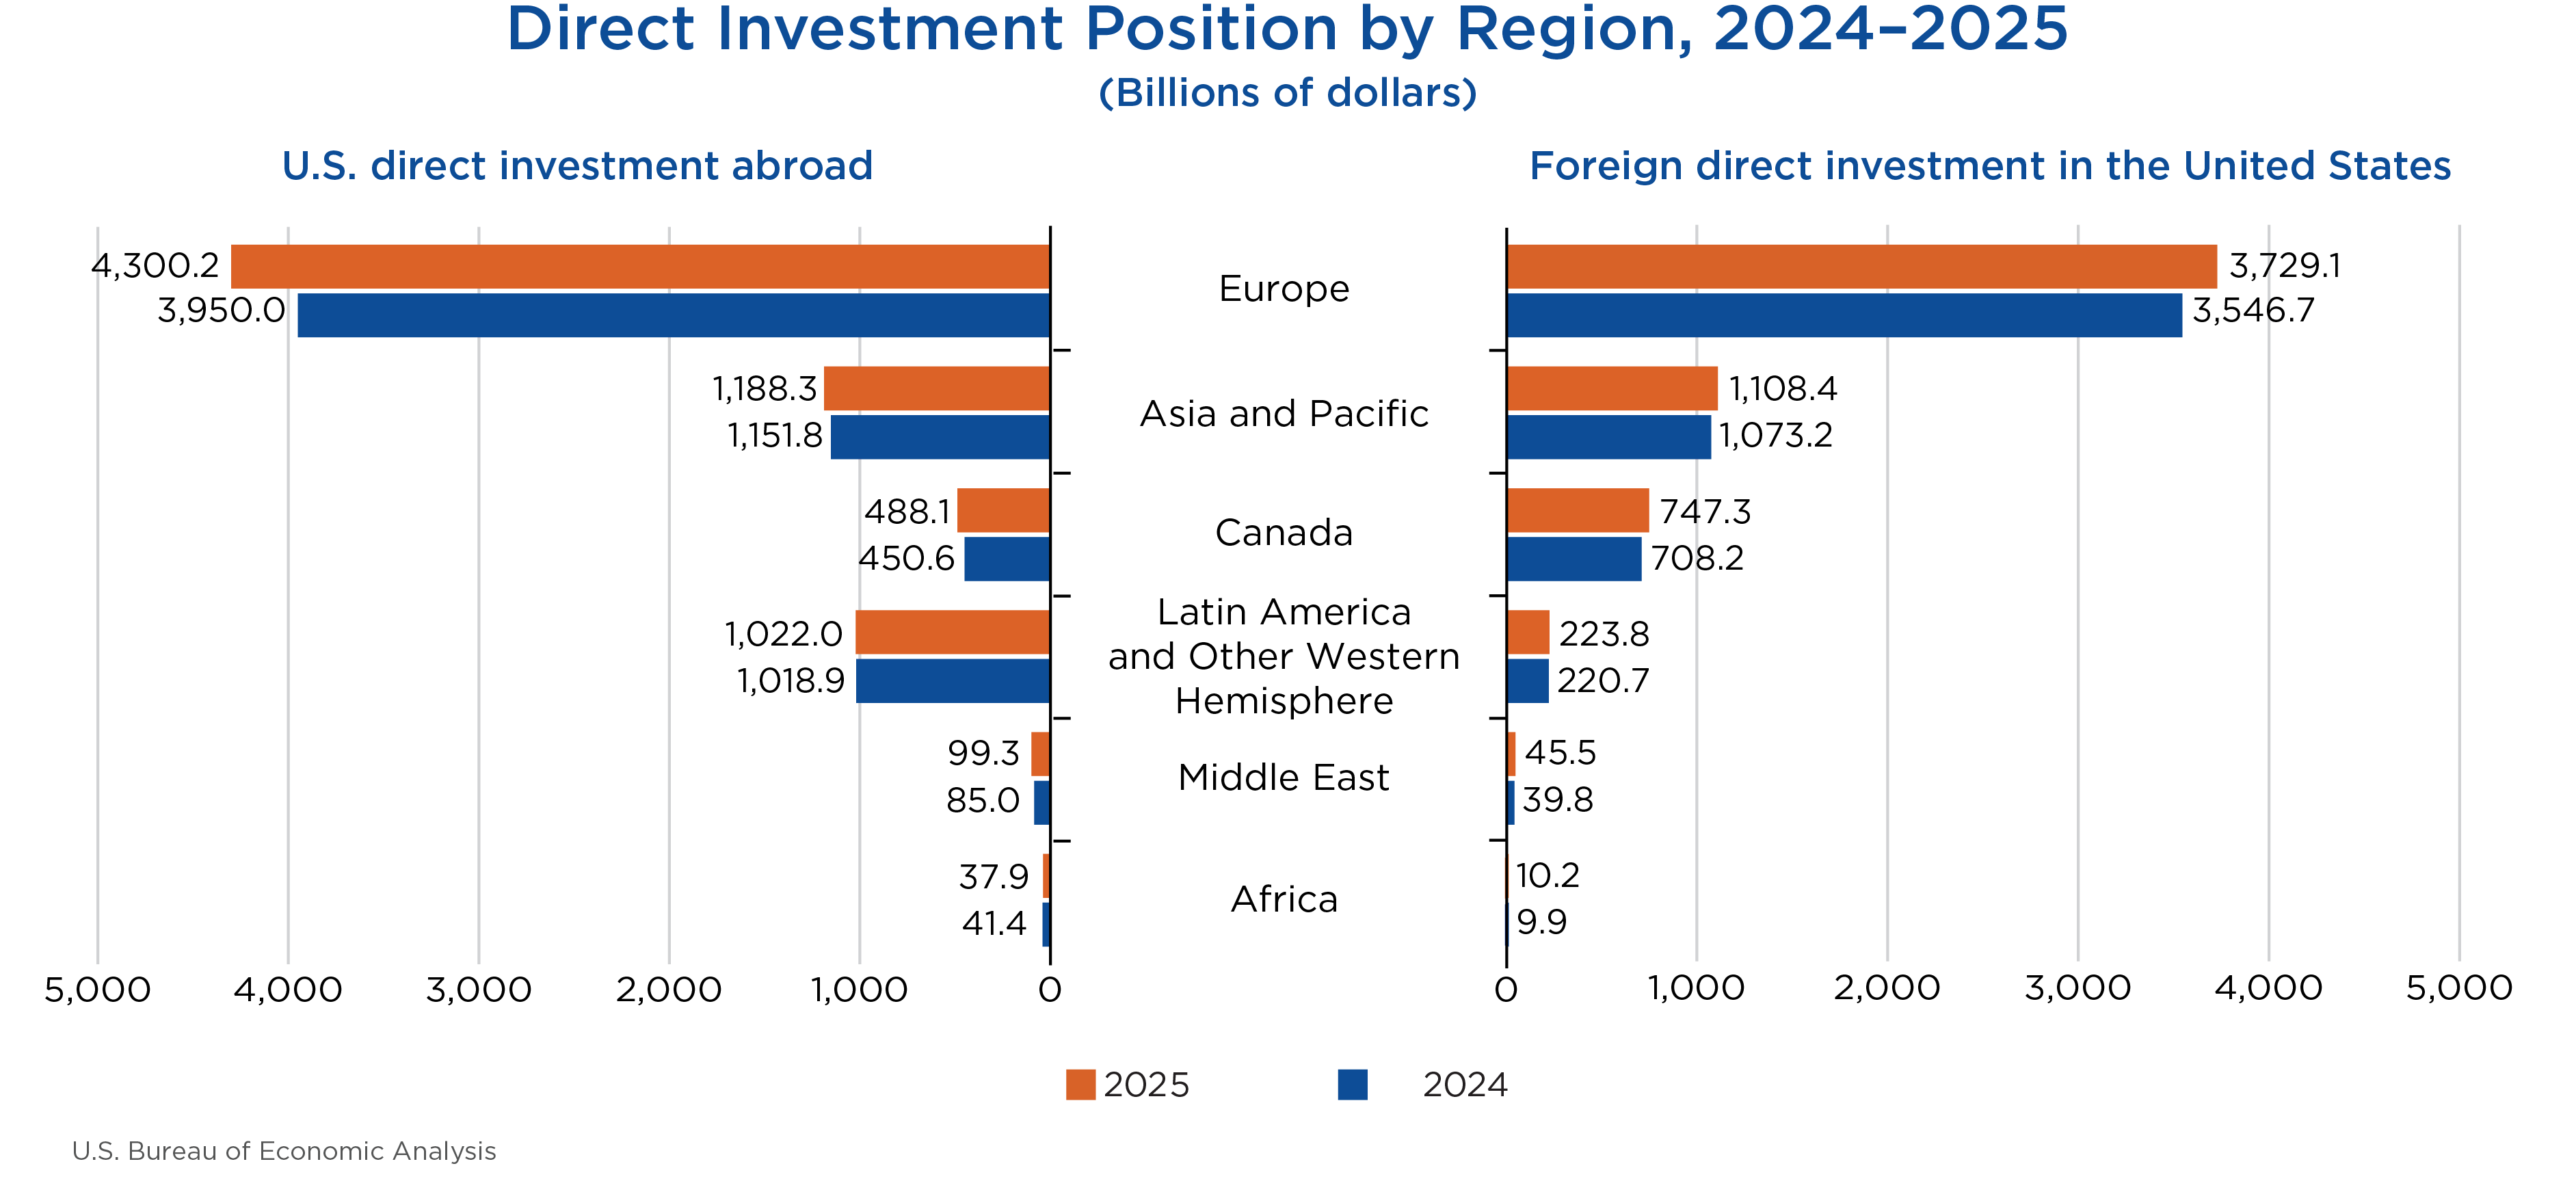
The U.S. direct investment abroad position, or cumulative level of investment, increased $438.1 billion to $7.14 trillion at the end of 2025, according to statistics released today by the U.S. Bureau of Economic Analysis. The increase was led by a $350.2 billion increase in the position in Europe, primarily in the United Kingdom and Luxembourg. By industry, manufacturing had the largest increase, led by chemical manufacturing.
The foreign direct investment in the United States position increased $266.0 billion to $5.86 trillion at the end of 2025. The increase was led by a $182.4 billion increase in the position from Europe. The largest increase in position was from German multinationals, with a $49.0 billion increase, and the second-largest increase in position was from Canadian multinationals, with a $39.2 billion increase. By industry, manufacturing increased the most, led by electrical equipment and components manufacturing.
Principal Federal Economic Indicators
Noteworthy


The Latest
Direct Investment by Country and Industry, 2025
The U.S. direct investment abroad position, or cumulative level of investment, increased $438.1 billion to $7.14 trillion at the end of 2025, according to statistics released today by the U.S. Bureau of Economic Analysis. The increase was led by a $350.2 billion increase in the position in Europe, primarily in the United Kingdom and Luxembourg. By industry, manufacturing had the largest increase, led by chemical manufacturing. The foreign…
Activities of U.S. Affiliates of Foreign Multinational Enterprises, 2024
Majority-owned U.S. affiliates of foreign multinational enterprises employed 8.57 million workers in the United States in 2024, a 0.2 percent increase from 8.56 million workers in 2023, according to statistics on U.S. affiliate operations and finances released today by the U.S. Bureau of Economic Analysis.
U.S. International Trade in Goods and Services, May 2026
The U.S. goods and services trade deficit increased in May 2026 according to the U.S. Bureau of Economic Analysis and the U.S. Census Bureau. The deficit increased from $54.6 billion in April (revised) to $77.6 billion in May, as exports decreased and imports increased. The goods deficit increased $23.6 billion in May to $106.5 billion. The services surplus increased $0.6 billion in May to $28.9 billion.
Beyond the News Release: A Closer Look at First-Quarter 2026 State Personal Income
For each quarter of the year, BEA produces a wealth of state economic statistics. They are now featured in the same news release with industry statistics and the third estimate of U.S. gross domestic product each quarter.
Starting with the fourth quarter of 2025, BEA accelerated its production of state GDP and personal income statistics to present this comprehensive picture of the economy on the same day.
BEA Expands Statistics and Data Tool for Analyzing Global Value Chains
BEA has significantly expanded its global value chain statistics to help policymakers and the public better understand international supply chains.
Global value chain statistics lay out the mix of domestic and imported value included in the cross-border production chains of goods and services. They are also known as statistics measuring trade in value added.
Personal Income and Outlays, May 2026
Personal income increased $181.6 billion (0.7 percent at a monthly rate) in May, according to estimates released today by the U.S. Bureau of Economic Analysis (BEA). Disposable personal income (DPI)—personal income less personal current taxes—increased $164.9 billion (0.7 percent), and personal consumption expenditures (PCE) increased $156.1 billion (0.7 percent). Personal outlays—the sum of PCE, personal interest payments, and personal current…
GDP (Third Estimate), Industries, Corporate Profits, State GDP, and State Personal Income, 1st Quarter 2026
Real gross domestic product (GDP) increased at an annual rate of 2.1 percent in the first quarter of 2026 (January, February, and March), according to the third estimate released today by the U.S. Bureau of Economic Analysis. In the fourth quarter of 2025, real GDP increased 0.5 percent. The contributors to the increase in real GDP in the first quarter were increases in investment, exports, government spending, and consumer spending. Imports,…
U.S. International Transactions and Investment Position, 1st Quarter 2026 and Annual Update
The U.S. current-account deficit resulting from international economic transactions widened by $5.8 billion, or 2.6 percent, to $226.8 billion in the first quarter of 2026, according to statistics released today by the U.S. Bureau of Economic Analysis. The revised fourth-quarter deficit was $221.1 billion. The first-quarter deficit was 2.9 percent of current-dollar gross domestic product, up from 2.8 percent in the fourth quarter.
Innovations in Distribution of Income Statistics: New Data and a New Tool
Build custom tables and charts from BEA's distribution of personal income statistics with BEA’s newest data analysis tool.
Advancing Measurement and Understanding of AI’s Economic Impact
A blog post from BEA Director Vipin Arora
I’m sure many of us remember playing the “don’t say it” game. Someone picks a word to avoid, and the first person to utter that word loses. Can you imagine how quickly the game would end these days if the word was AI?