
News Release
U.S. International Transactions, 4th Quarter and Year 2024
Current-Account Deficit Narrowed by 2.0 Percent in Fourth Quarter
Current-Account Balance, Fourth Quarter (Table 1 and Chart 1)
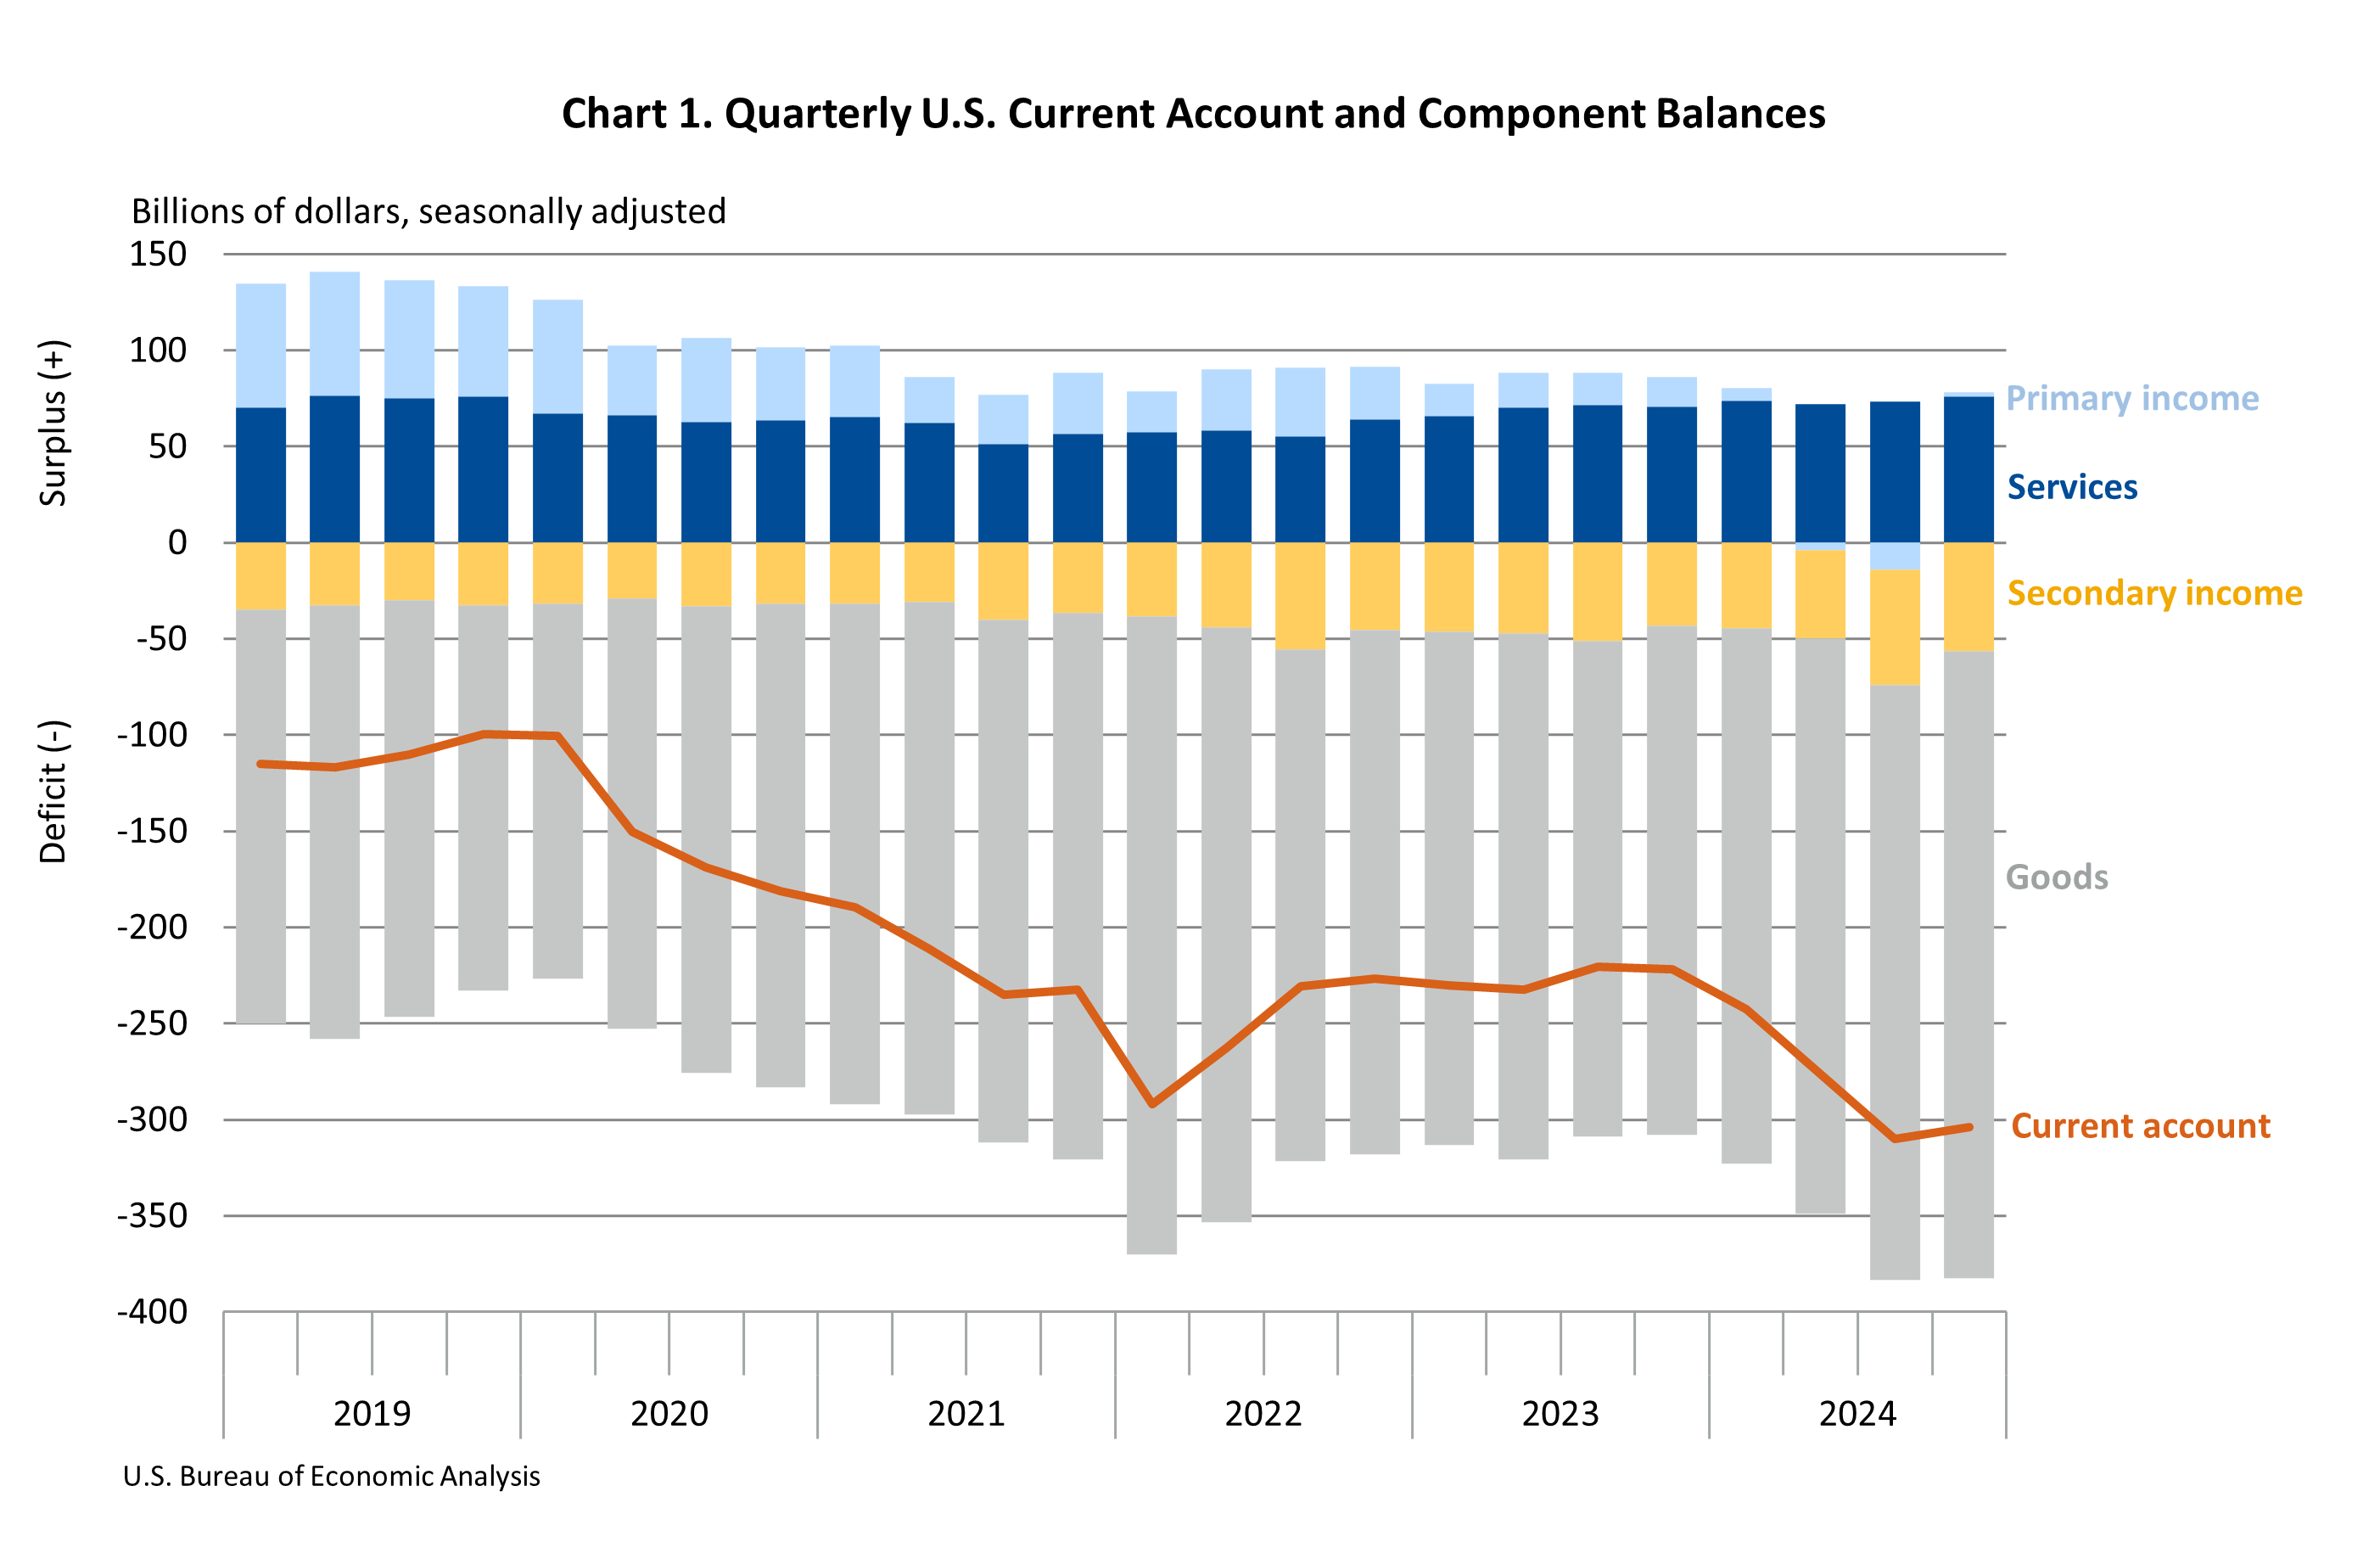
The U.S. current-account deficit, which reflects the combined balances on trade in goods and services and income flows between U.S. residents and residents of other countries, narrowed by $6.3 billion, or 2.0 percent, to $303.9 billion in the fourth quarter of 2024, according to statistics released today by the U.S. Bureau of Economic Analysis. The revised third-quarter deficit was $310.3 billion (table A).
The fourth-quarter deficit was 4.1 percent of current-dollar gross domestic product (GDP), down from 4.2 percent in the third quarter.
The $6.3 billion narrowing of the current-account deficit in the fourth quarter reflected a shift in the balance on primary income from a deficit in the third quarter to a surplus in the fourth quarter and changes in the balances on secondary income and on services that, collectively, were largely offset by an expanded deficit on goods.
Current-Account Transactions (Tables 1–5 and Chart 2)
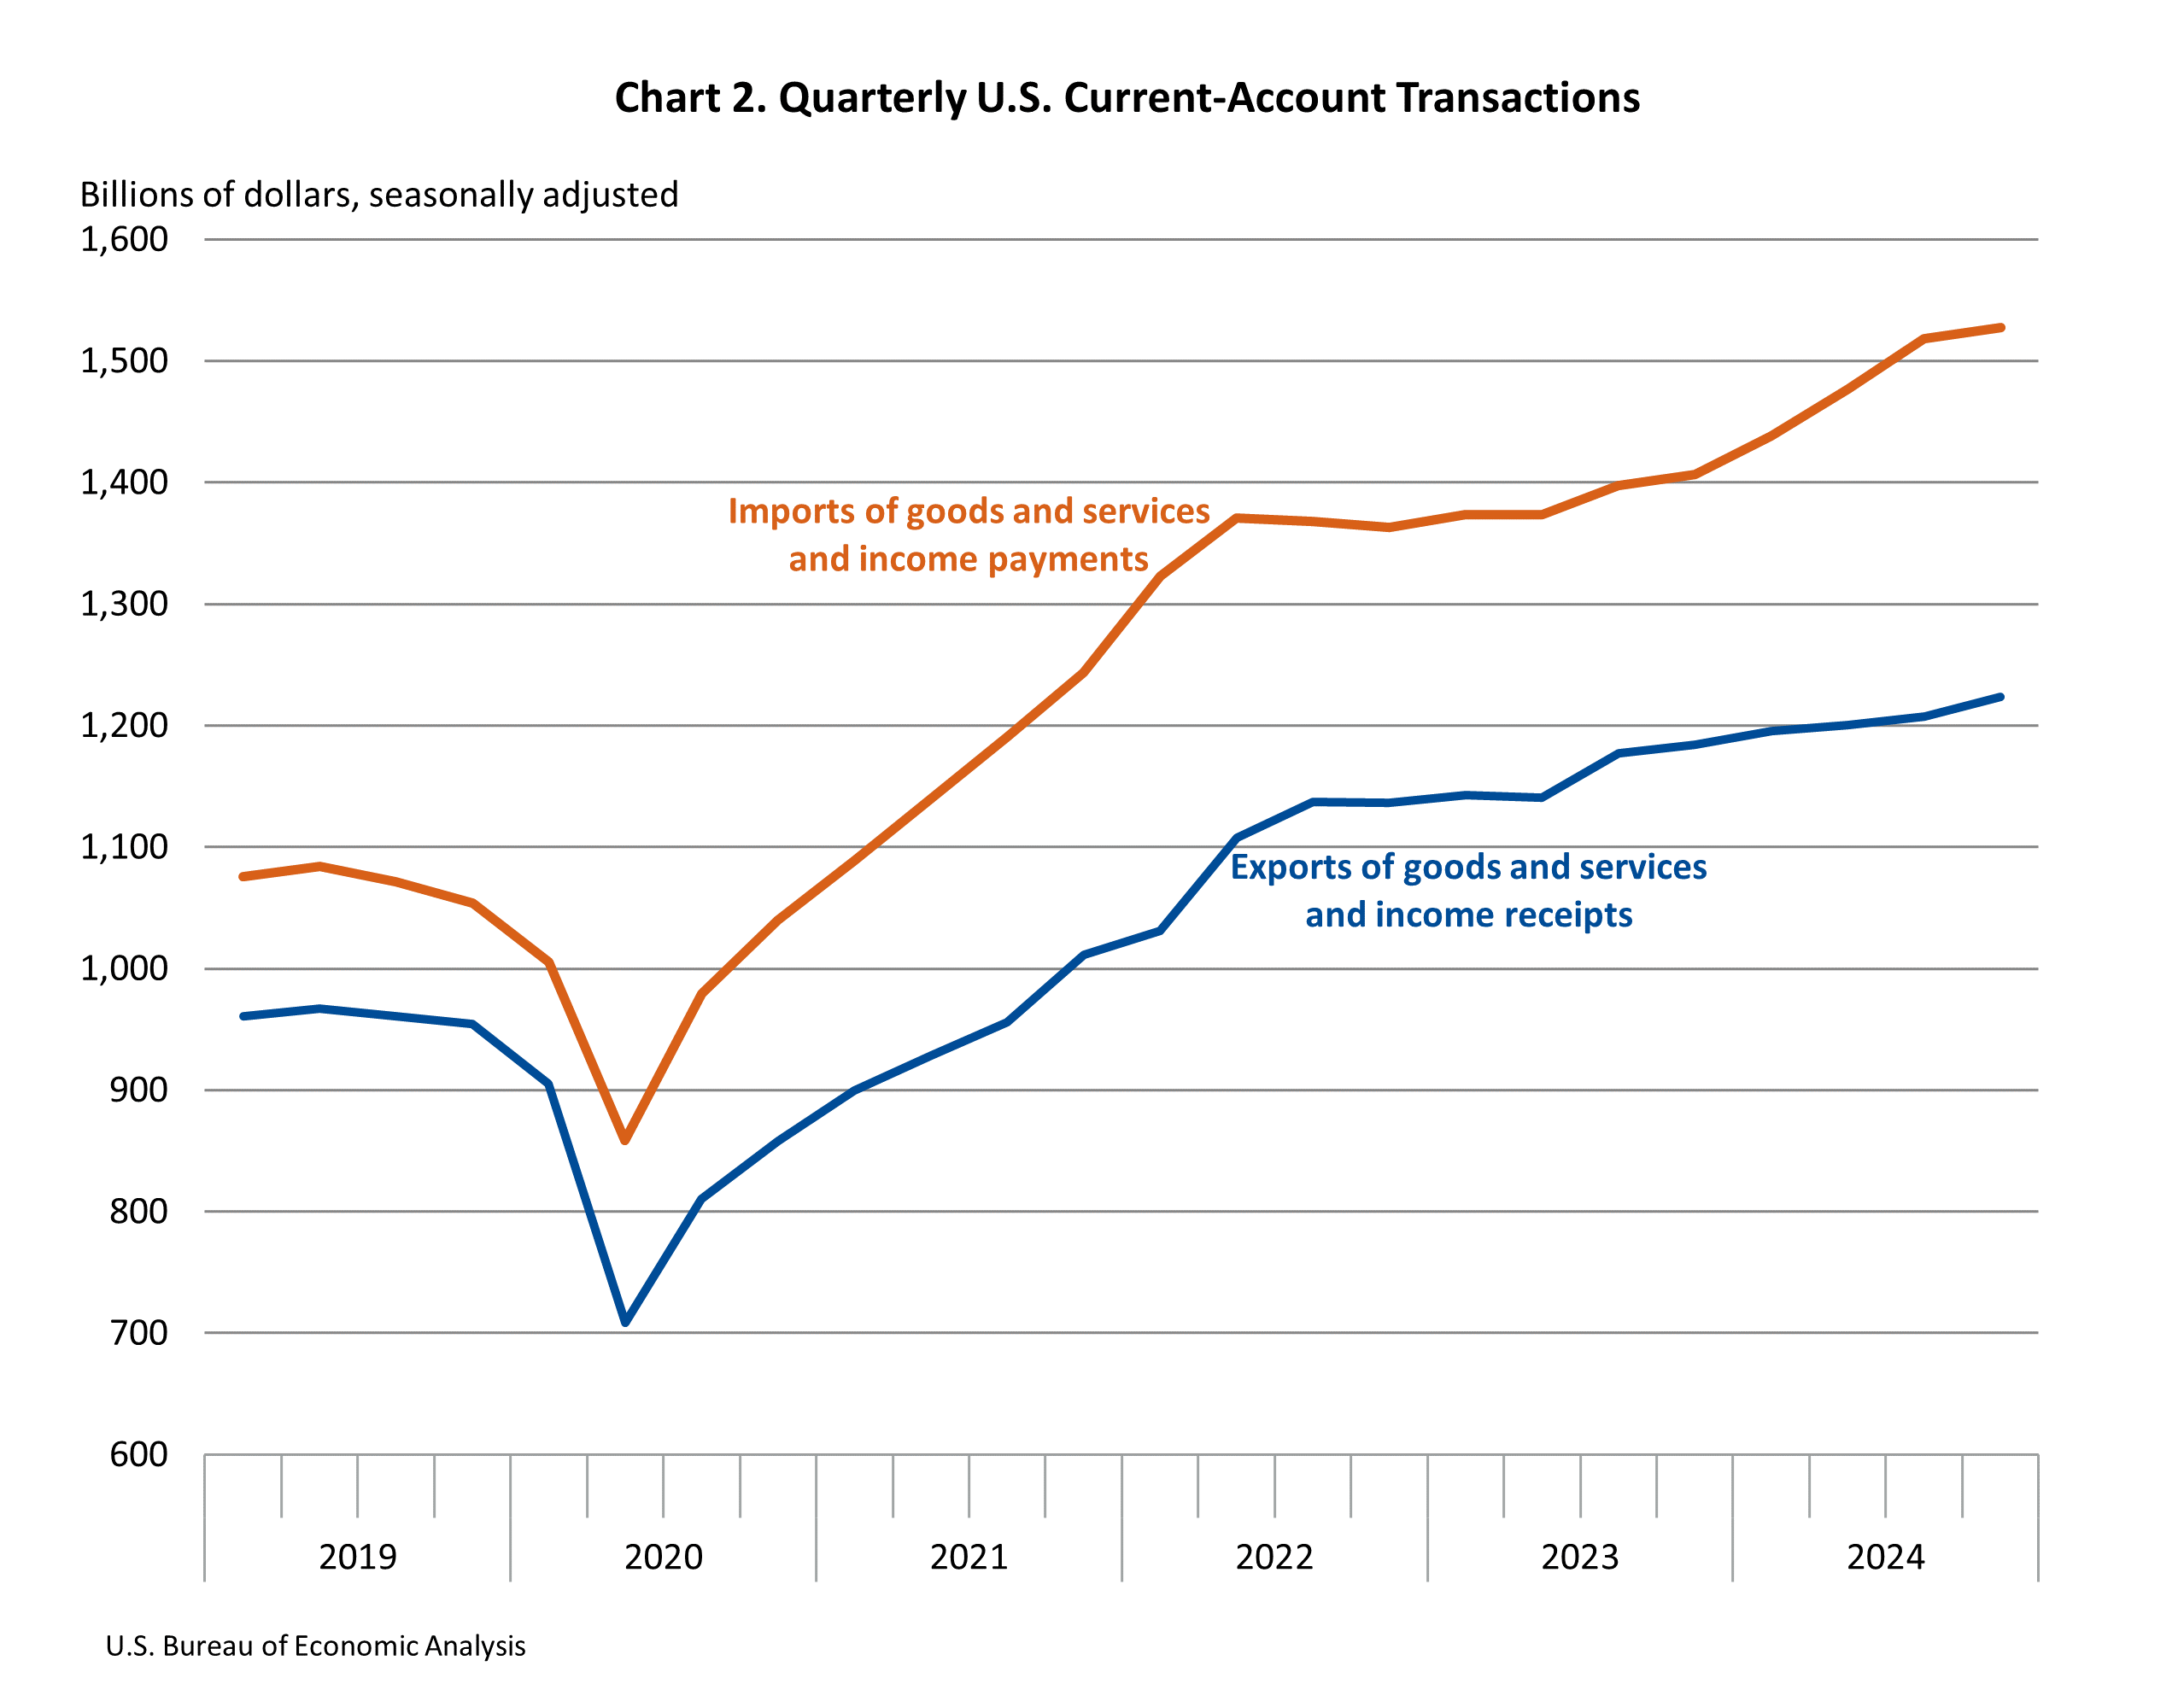
Exports of goods and services to, and income received from, foreign residents increased $16.1 billion to $1.22 trillion in the fourth quarter. Imports of goods and services from, and income paid to, foreign residents increased $9.7 billion to $1.53 trillion.1
Trade in goods (Table 2)
Exports of goods decreased $10.8 billion to $519.2 billion, reflecting decreases in capital goods, mostly civilian aircraft; computer accessories, peripherals, and parts; and semiconductors, and in consumer goods, mostly medicinal, dental, and pharmaceutical products. Imports of goods increased $5.7 billion to $845.3 billion, reflecting partly offsetting changes in most major components. The largest increase was in nonmonetary gold (see “Additional Information” for a definition of nonmonetary gold). The largest decrease was in capital goods, mostly computers.
Trade in services (Table 3)
Exports of services increased $7.7 billion to $287.1 billion, reflecting increases in charges for the use of intellectual property, mostly licenses for the use of outcomes of research and development, and in travel, mostly “other personal travel.” Imports of services increased $4.8 billion to $211.0 billion, reflecting an increase in travel, mostly other personal travel.
Primary income (Table 4)
Receipts of primary income increased $18.6 billion to $366.3 billion, reflecting an increase in direct investment income, mainly earnings, that was partly offset by a decrease in “other investment income,” mostly interest on loans and deposits. Payments of primary income increased $2.4 billion to $363.9 billion, reflecting increases in portfolio investment income, mainly interest on long-term debt securities, and in direct investment income, mainly earnings, that were mostly offset by a decrease in other investment income, primarily interest on loans and deposits.
Secondary income (Table 5)
Receipts of secondary income increased $0.7 billion to $51.2 billion, reflecting an increase in general government transfers, mostly fines and penalties. Payments of secondary income decreased $3.2 billion to $107.4 billion, reflecting a decrease in general government transfers, primarily international cooperation, that was partly offset by an increase in private transfers, mostly insurance-related transfers.
Capital-Account Transactions (Table 1)
Capital-transfer receipts increased $9.6 billion to $11.3 billion in the fourth quarter. Fourth-quarter transactions reflected receipts from foreign insurance companies for losses resulting from Hurricane Milton. For information on transactions associated with hurricanes and other disasters, see “How do losses recovered from foreign insurance companies following natural or man-made disasters affect foreign transactions, the current account balance, and net lending or net borrowing?”. Capital-transfer payments decreased $2.2 billion to $1.1 billion, reflecting a decrease in infrastructure grants.
Financial-Account Transactions (Tables 1, 6, 7, and 8 and Chart 3)
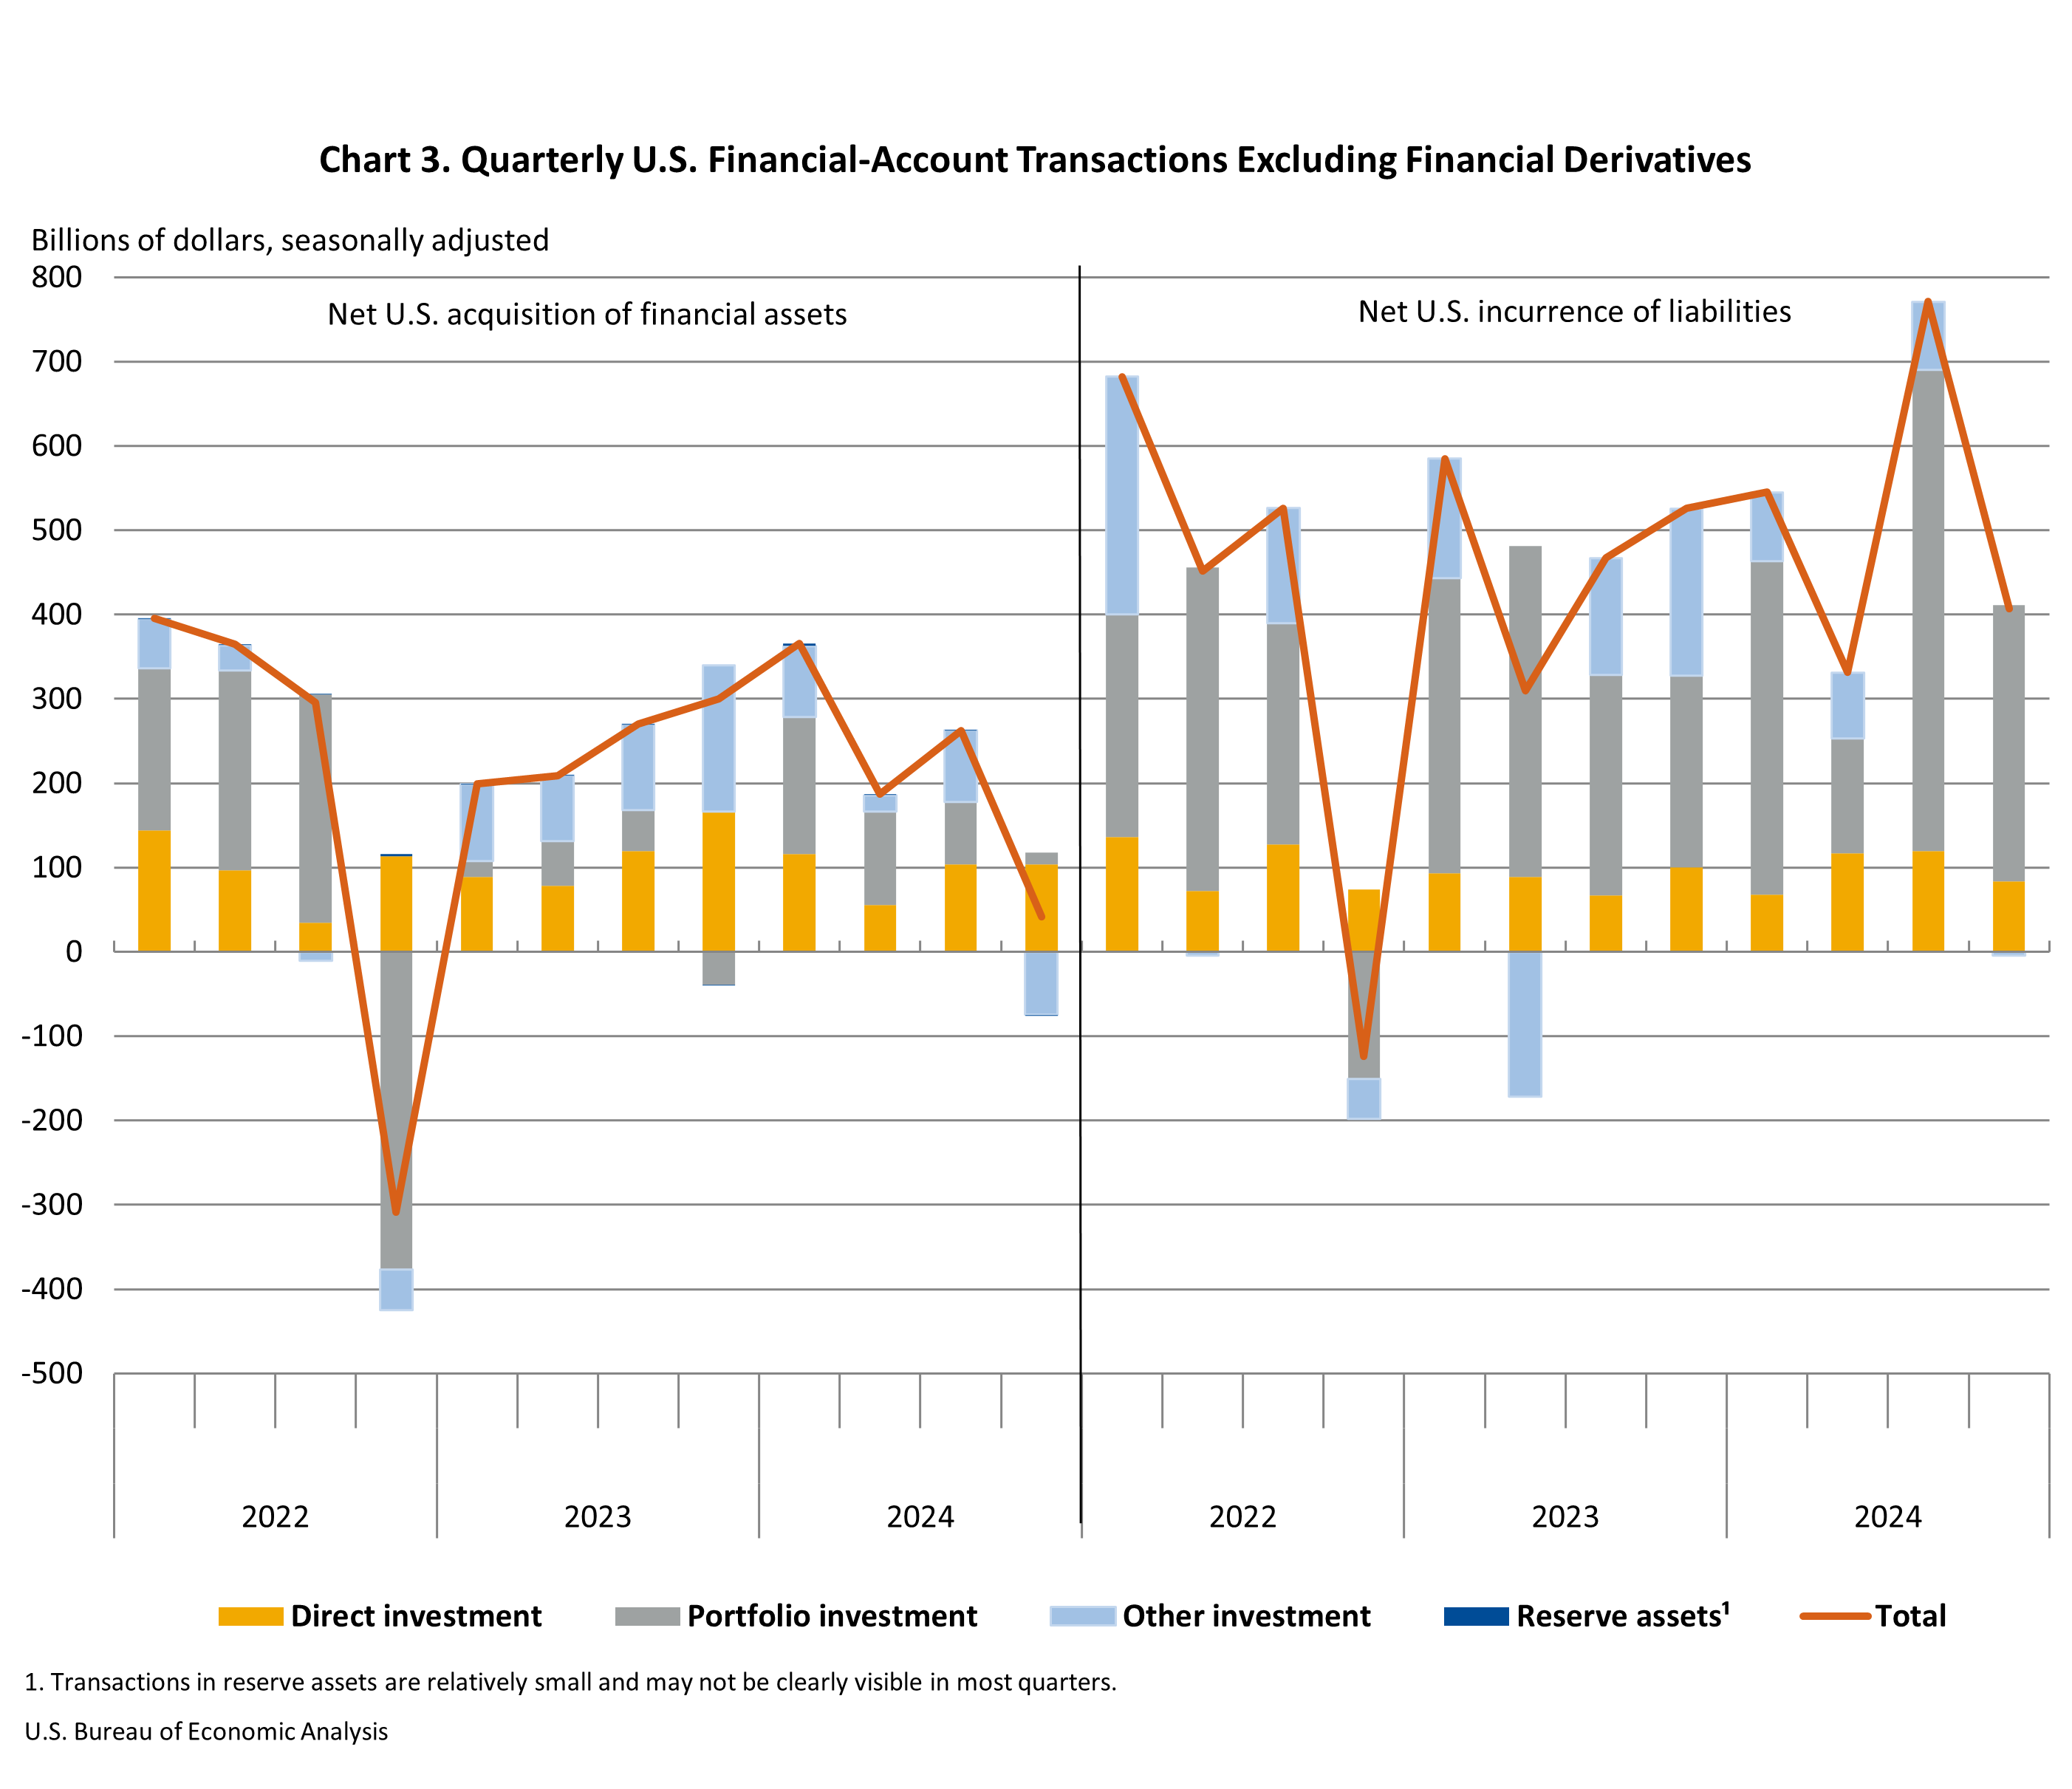
Net financial-account transactions were −$385.3 billion in the fourth quarter, reflecting net U.S. borrowing from foreign residents.
Financial assets (Tables 1, 6, 7, and 8)
Fourth-quarter transactions increased U.S. residents’ foreign financial assets by $41.4 billion. Transactions increased direct investment assets, mainly equity, by $103.6 billion, and portfolio investment assets, both equity and debt securities, by $13.7 billion. Transactions decreased “other investment assets” by $74.9 billion, resulting from a decrease in loans that was partly offset by an increase in deposits, and reserve assets by $1.1 billion.
Liabilities (Tables 1, 6, 7, and 8)
Fourth-quarter transactions increased U.S. liabilities to foreign residents by $406.6 billion. Transactions increased portfolio investment liabilities, both equity and long-term debt securities, by $328.0 billion, and direct investment liabilities, primarily equity, by $83.5 billion. Transactions decreased “other investment liabilities” by $4.9 billion, resulting from offsetting transactions in deposits, loans, and trade credit and advances.
Financial derivatives (Table 1)
Net transactions in financial derivatives were –$20.0 billion in the fourth quarter, reflecting net U.S. borrowing from foreign residents.
|
Table A. Updates to Third-Quarter 2024 International Transactions Accounts Balances [Billions of dollars, seasonally adjusted] |
||
| Preliminary estimates | Revised estimates | |
|---|---|---|
| Current-account balance | –310.9 | −310.3 |
| Goods balance | −307.3 | −309.6 |
| Services balance | 73.7 | 73.2 |
| Primary income balance | −15.5 | −13.8 |
| Secondary income balance | −61.9 | −60.1 |
| Net financial-account transactions | −493.6 | −486.1 |
| U.S. Bureau of Economic Analysis | ||
In addition to revisions to source data for the third quarter of 2024, seasonally adjusted statistics for the first, second, and third quarters of 2024 were revised to force the sum of seasonally adjusted quarters to equal the annual totals. This forcing procedure was also applied to the fourth quarter of 2024 (table A).
Current-Account Balance, Year 2024 (Table 1)
The U.S. current-account deficit widened by $228.2 billion, or 25.2 percent, to $1.13 trillion in 2024. The deficit was 3.9 percent of current-dollar GDP, up from 3.3 percent in 2023. The $228.2 billion widening of the current-account deficit in 2024 mostly reflected an expanded deficit on goods. Also contributing was a shift in the balance on primary income from a surplus in 2023 to a deficit in 2024.
Current-Account Transactions (Tables 1–5)
Exports of goods and services to, and income received from, foreign residents increased $181.8 billion to $4.83 trillion in 2024. Imports of goods and services from, and income paid to, foreign residents increased $410.1 billion to $5.96 trillion.
Trade in goods (Table 2)
Exports of goods increased $38.0 billion to $2.08 trillion, reflecting an increase in capital goods, mainly civilian aircraft engines and parts and computer accessories, peripherals, and parts. Imports of goods increased $187.7 billion to $3.30 trillion, reflecting increases in capital goods, mainly computer accessories, peripherals, and parts and computers, and in consumer goods, mostly medicinal, dental, and pharmaceutical products.
Trade in services (Table 3)
Exports of services increased $80.8 billion to $1.11 trillion, and imports of services increased $64.0 billion to $812.2 billion. The increases in both exports and imports reflected increases in most major components, led by travel, mostly other personal travel.
Primary income (Table 4)
Receipts of primary income increased $58.0 billion to $1.43 trillion, and payments of primary income increased $133.9 billion to $1.44 trillion. The increases in both receipts and payments reflected increases in all major components. The increase in receipts was led by other investment income, primarily interest on loans and deposits. The increase in payments was led by portfolio investment income, mostly interest on long-term debt securities.
Secondary income (Table 5)
Receipts of secondary income increased $5.0 billion to $201.7 billion, and payments of secondary income increased $24.4 billion to $408.6 billion. The increases in both receipts and payments reflected increases in private transfers, mainly insurance-related transfers.
Capital-Account Transactions (Table 1)
Capital-transfer receipts increased $12.9 billion to $13.0 billion in 2024. Transactions in 2024 reflected receipts from foreign insurance companies for losses resulting from Hurricane Helene in the third quarter and Hurricane Milton in the fourth quarter. Capital-transfer payments increased $1.3 billion to $7.7 billion, reflecting an increase in infrastructure grants.
Financial-Account Transactions (Tables 1, 6, 7, and 8)
Net financial-account transactions were −$1.27 trillion in 2024, reflecting net U.S. borrowing from foreign residents.
Financial assets (Tables 1, 6, 7, and 8)
Transactions in 2024 increased U.S. residents’ foreign financial assets by $855.9 billion. Transactions increased direct investment assets, mostly equity, by $379.1 billion; portfolio investment assets, both long-term debt securities and equity, by $361.0 billion; other investment assets, primarily deposits, by $113.6 billion; and reserve assets by $2.1 billion.
Liabilities (Tables 1, 6, 7, and 8)
Transactions in 2024 increased U.S. liabilities to foreign residents by $2.05 trillion. Transactions increased portfolio investment liabilities, both long-term debt securities and equity, by $1.43 trillion; direct investment liabilities, mostly equity, by $388.0 billion; and other investment liabilities by $235.5 billion, resulting from an increase in loans that was partly offset by a decrease in deposits.
Financial derivatives (Table 1)
Net transactions in financial derivatives were –$70.9 billion in 2024, reflecting net U.S. borrowing from foreign residents.
Upcoming Update to the U.S. International Transactions Accounts
The annual update of the International Transactions Accounts will be released along with preliminary estimates for the first quarter of 2025 on June 24, 2025. A preview of the annual update will be available in the Survey of Current Business in April 2025.
Next release: June 24, 2025, at 8:30 a.m. EDT
U.S. International Transactions, 1st Quarter 2025 and Annual Update
1 U.S. international transactions are presented in current dollars in accordance with international statistical presentation guidelines. For a comparison of current-dollar, or nominal, and inflation-adjusted, or real, measures of international transactions, see “SECTION 4 – FOREIGN TRANSACTIONS” of the National Income and Product Accounts.